Markets
News
Analysis
User
24/7
Economic Calendar
Education
Data
- Names
- Latest
- Prev
A:--
F: --
A:--
F: --
P: --
A:--
F: --
P: --
A:--
F: --
P: --
A:--
F: --
P: --
A:--
F: --
P: --
A:--
F: --
P: --
A:--
F: --
P: --
A:--
F: --
P: --
A:--
F: --
P: --
A:--
F: --
P: --
A:--
F: --
P: --
A:--
F: --
P: --
A:--
F: --
P: --
A:--
F: --
P: --
A:--
F: --
A:--
F: --
P: --
A:--
F: --
P: --
A:--
F: --
P: --
A:--
F: --
P: --
A:--
F: --
P: --
A:--
F: --
A:--
F: --
P: --
A:--
F: --
P: --
A:--
F: --
A:--
F: --
P: --
A:--
F: --
P: --
A:--
F: --
P: --
--
F: --
P: --
--
F: --
P: --
--
F: --
P: --
--
F: --
P: --
--
F: --
P: --
--
F: --
P: --
--
F: --
P: --
--
F: --
P: --
--
F: --
P: --
--
F: --
P: --
--
F: --
P: --
--
F: --
P: --
--
F: --
P: --
--
F: --
P: --
--
F: --
P: --
--
F: --
P: --
--
F: --
P: --
--
F: --
P: --
--
F: --
P: --
--
F: --
P: --
--
F: --
P: --
--
F: --
P: --
--
F: --
P: --
--
F: --
P: --
--
F: --
P: --
--
F: --
P: --
--
F: --
P: --
--
F: --
P: --
--
F: --
P: --
--
F: --
P: --
No matching data
Latest Views
Latest Views
Trending Topics
To quickly learn market dynamics and follow market focuses in 15 min.
In the world of mankind, there will not be a statement without any position, nor a remark without any purpose.
Inflation, exchange rates, and the economy shape the policy decisions of central banks; the attitudes and words of central bank officials also influence the actions of market traders.
Money makes the world go round and currency is a permanent commodity. The forex market is full of surprises and expectations.
Top Columnists
Enjoy exciting activities, right here at FastBull.
The latest breaking news and the global financial events.
I have 5 years of experience in financial analysis, especially in aspects of macro developments and medium and long-term trend judgment. My focus is maily on the developments of the Middle East, emerging markets, coal, wheat and other agricultural products.
BeingTrader chief Trading Coach & Speaker, 8+ years of experience in the forex market trading mainly XAUUSD, EUR/USD, GBP/USD, USD/JPY, and Crude Oil. A confident trader and analyst who aims to explore various opportunities and guide investors in the market. As an analyst I am looking to enhance the trader’s experience by supporting them with sufficient data and signals.
Latest Update
Risk Warning on Trading HK Stocks
Despite Hong Kong's robust legal and regulatory framework, its stock market still faces unique risks and challenges, such as currency fluctuations due to the Hong Kong dollar's peg to the US dollar and the impact of mainland China's policy changes and economic conditions on Hong Kong stocks.
HK Stock Trading Fees and Taxation
Trading costs in the Hong Kong stock market include transaction fees, stamp duty, settlement charges, and currency conversion fees for foreign investors. Additionally, taxes may apply based on local regulations.
HK Non-Essential Consumer Goods Industry
The Hong Kong stock market encompasses non-essential consumption sectors like automotive, education, tourism, catering, and apparel. Of the 643 listed companies, 35% are mainland Chinese, making up 65% of the total market capitalization. Thus, it's heavily influenced by the Chinese economy.
HK Real Estate Industry
In recent years, the real estate and construction sector's share in the Hong Kong stock index has notably decreased. Nevertheless, as of 2022, it retains around 10% market share, covering real estate development, construction engineering, investment, and property management.
Hongkong, China
Ho Chi Minh, Vietnam
Dubai, UAE
Lagos, Nigeria
Cairo, Egypt
White Label
Data API
Web Plug-ins
Affiliate Program
View All
No data
Not Logged In
Log in to access more features
FastBull Membership
Not yet
Purchase
Log In
Sign Up
Hongkong, China
Ho Chi Minh, Vietnam
Dubai, UAE
Lagos, Nigeria
Cairo, Egypt
White Label
Data API
Web Plug-ins
Affiliate Program
Key Highlights Bitcoin price is consolidating above the $94,000 support zone. BTC is facing hurdles near a key bearish trend line with resistance at $97,250 on the 4-hour chart. Ethereum price is struggling to gain pace for a move above $2,850 and $3,000.
Key Highlights
Bitcoin price is consolidating above the $94,000 support zone.
BTC is facing hurdles near a key bearish trend line with resistance at $97,250 on the 4-hour chart.
Ethereum price is struggling to gain pace for a move above $2,850 and $3,000.
GBP/USD aims for a move above the 1.2630 and 1.2650 levels.
Bitcoin Price Technical Analysis
Bitcoin price made a couple of attempts to settle above $100,000 against the US Dollar. However, BTC bears remained active and prevented a steady increase.
Looking at the 4-hour chart, the price remained stable above the 76.4% Fib retracement level of the upward move from the $91,352 swing low to the $102,295 high, but it is also below the 100 simple moving average (red, 4-hour) and the 200 simple moving average (green, 4-hour).
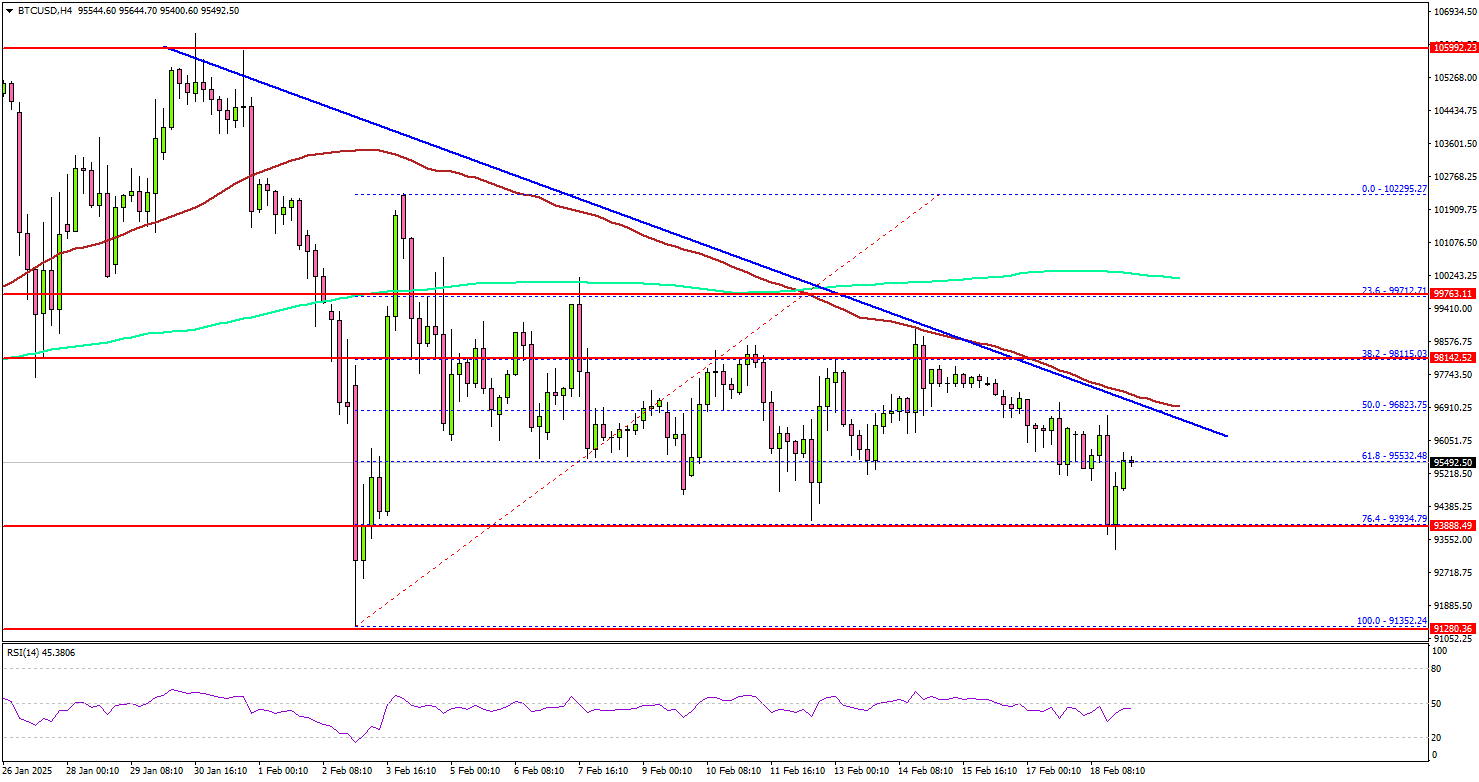
On the upside, the price could face resistance near the $97,500 level and the 100 simple moving average (red, 4-hour). There is also a key bearish trend line forming with resistance at $97,250 on the same chart.
The next key resistance is $100,000 and the 200 simple moving average (green, 4-hour). A successful close above $100,000 might start another steady increase. In the stated case, the price may perhaps rise toward the $105,000 level.
Immediate support is near the $95,500 level. The next key support sits at $94,000. A downside break below $94,000 might send Bitcoin toward the $92,000 support. Any more losses might send the price toward the $91,200 support zone.
Looking at Ethereum, there was a recovery wave above $2,650 but the bears remained active near the $2,850 resistance zone.
Today’s Economic Releases
US Housing Starts for Jan 2025 (MoM) – Forecast 1.40M, versus 1.499M previous.
US Building Permits for Jan 2025 (MoM) – Forecast 1.460M, versus 1.482M previous.
NZD/USD could rise toward the upper boundary of the ascending channel at 0.5790 level.
The 14-day RSI remains above the 50 mark, strengthening the bullish sentiment.
The immediate supports appear at nine- and 14-day EMAs of 0.5695 and 0.5685, respectively.
The NZD/USD pair trades near 0.5710 during Asian hours on Wednesday. However, the pair faced challenges following the Reserve Bank of New Zealand’s (RBNZ) decision to lower the Official Cash Rate (OCR) by 50 basis points (bps) from 4.25% to 3.75%.
RBNZ Governor Adrian Orr delivers prepared remarks on the policy statement and addresses media questions at the post-meeting press conference. Orr said that the OCR path forecasts a 50 bps reduction by mid-year, likely around July, in two 25 bps increments. The economy has substantial spare capacity, making rate cuts in April and May appropriate.
Technical analysis of the daily chart indicates a bullish market sentiment, with the pair remaining within an ascending channel pattern. The 14-day Relative Strength Index (RSI) stays above the 50 mark, reinforcing the bullish outlook. Additionally, the NZD/USD pair is positioned above the nine- and 14-day Exponential Moving Averages (EMAs), signaling a stronger short-term momentum.
To the upside, the NZD/USD pair could rise toward the upper boundary of the ascending channel at the 0.5790 level, followed by the two-month high of 0.5794, reached on January 24.
The NZD/USD pair tests immediate support at the nine-day EMA at 0.5695, followed by a 14-day EMA at 0.5685 level. Further support region appears at the ascending channel’s lower boundary at 0.5650 level.
A break below the channel would weaken the bullish bias and put downward pressure on the NZD/USD pair to navigate the region around 0.5516, its lowest point since October 2022, recorded on February 3.
NZD/USD: Daily Chart
New Zealand Dollar PRICE Today
The table below shows the percentage change of New Zealand Dollar (NZD) against listed major currencies today. New Zealand Dollar was the strongest against the Japanese Yen.
USD | EUR | GBP | JPY | CAD | AUD | NZD | CHF | |
---|---|---|---|---|---|---|---|---|
USD | -0.03% | -0.07% | 0.00% | -0.03% | -0.15% | -0.27% | 0.00% | |
EUR | 0.03% | -0.04% | 0.06% | -0.00% | -0.12% | -0.24% | 0.03% | |
GBP | 0.07% | 0.04% | 0.08% | 0.04% | -0.08% | -0.20% | 0.07% | |
JPY | 0.00% | -0.06% | -0.08% | -0.05% | -0.17% | -0.30% | -0.02% | |
CAD | 0.03% | 0.00% | -0.04% | 0.05% | -0.12% | -0.24% | 0.03% | |
AUD | 0.15% | 0.12% | 0.08% | 0.17% | 0.12% | -0.11% | 0.15% | |
NZD | 0.27% | 0.24% | 0.20% | 0.30% | 0.24% | 0.11% | 0.27% | |
CHF | -0.00% | -0.03% | -0.07% | 0.02% | -0.03% | -0.15% | -0.27% |
The heat map shows percentage changes of major currencies against each other. The base currency is picked from the left column, while the quote currency is picked from the top row. For example, if you pick the New Zealand Dollar from the left column and move along the horizontal line to the US Dollar, the percentage change displayed in the box will represent NZD (base)/USD (quote).
The Japanese Yen attracts sellers for the second straight day due to a positive risk tone.
Bets for more interest rate hikes by the BoJ should help limit deeper losses for the JPY.
The divergent BoJ-Fed expectations should contribute to capping gains for USD/JPY.
The Japanese Yen (JPY) struggles to capitalize on a modest Asian session uptick and turns lower for the second consecutive day against its American counterpart on Wednesday. The optimism over a delay in the implementation of Trump's reciprocal tariffs and talks aimed at ending the Russia-Ukraine war remains supportive of a positive tone around the equity markets. This, in turn, is seen as a key factor undermining the safe-haven JPY, which, along with a modest US Dollar (USD) uptick, assists the USD/JPY pair to rebound around 40 pips from the daily low.
Any meaningful JPY depreciation, however, seems elusive in the wake of rising bets that the Bank of Japan (BoJ) will hike interest rates further amid signs of broadening inflation. Meanwhile, hawkish BoJ expectations led to the recent significant rise in Japanese bond yields. The resultant narrowing of the rate differential between Japan and other countries supports prospects for the emergence of some JPY dip-buying. This, in turn, warrants some caution before placing aggressive bullish bets around the USD/JPY pair ahead of the release of the FOMC minutes later today.
Japanese Yen bulls have the upper hand amid hawkish BoJ expectations
Bank of Japan Governor Kazuo Ueda and Deputy Governor Himino recently signaled the possibility of another rate hike if the economy and prices align with the projections.
Adding to this, BoJ Board Member Hajime Takata said on Wednesday that the central bank must gradually shift policy to avoid upside price risks from materializing.
Moreover, Japan's upbeat Q4 Gross Domestic Product (GDP) print on Monday boosted bets for further policy tightening by the BoJ amid signs of persistently high inflation.
The International Monetary Fund estimates Japan's neutral rate to be between 1% and 2%, and anticipates the BoJ to raise rates to around the mid-point of 1.5% by the end of 2027.
The yield on the benchmark 10-year Japanese government bond reached levels not seen since 2010 earlier this week, which should continue to underpin the Japanese Yen.
Officials from the US and Russia held a crucial meeting in Saudi Arabia to discuss ways to halt the almost three-year-old war in Ukraine and also agreed to hold more talks.
Furthermore, a delay in the implementation of US President Donald Trump's reciprocal tariffs remains supportive of a positive risk tone and undermines the safe-haven JPY.
Market participants now look forward to the release of minutes of the Federal Reserve's latest policy meeting in January for fresh cues about the future interest rate-cut path.
USD/JPY could attract fresh supply and remain capped near the 200-day SMA
From a technical perspective, any subsequent move up is more likely to face stiff resistance near the 200-day Simple Moving Average (SMA), currently pegged near the 152.65 region. This is followed by the 153.00 mark and the 100-day SMA barrier, around the 153.30-153.35 zone, which if cleared decisively should pave the way for additional gains. The USD/JPY pair might then accelerate the positive move towards reclaiming the 154.00 mark en route to the 154.45-154.50 supply zone, last week's swing high, around the 154.75-154.80 region, and the 155.00 psychological mark.
On the flip side, weakness below the 151.75 area, or the Asian session trough, could extend towards the overnight swing low, around the 151.25 region. Some follow-through selling, leading to a subsequent breakdown below the 151.00 mark, will be seen as a fresh trigger for bearish traders. The USD/JPY pair might then accelerate the fall towards the 150.60 intermediate support before eventually dropping to the 150.00 psychological mark. The downward trajectory could extend further towards the 149.60-149.55 region en route to the 149.00 mark and the December 2024 low, around the 148.65 region.
Silver price edges lower to $32.75 in Wednesday’s Asian session.
The constructive outlook of Silver remains in play above the 100-day EMA with the bullish RSI indicator.
The first upside barrier emerges at the $33.30-$33.40 region; the initial support level is located at $31.79.
Silver price (XAG/USD) attracts some sellers to near $32.75 during the Asian trading hours on Wednesday. The downside for the white metal might be limited amid the policy uncertainty, including tariff fears under US President Donald Trump’s administration. Later on Wednesday, the FOMC Minutes will be in the spotlight.
According to the daily chart, Silver keeps a bullish vibe at present as the price is well-supported above the key 100-day Exponential Moving Average (EMA). Furthermore, the upward momentum is supported by the 14-day Relative Strength Index (RSI), which is located above the midline near 66.30, suggesting that the path of least resistance is to the upside.
The immediate resistance level for Silver price emerges in the $33.30-$33.40 zone, representing the upper boundary of the Bollinger Band and the high of February 14. Any follow-through buying above this level could expose $34.55, the high of October 29, 2024. The next hurdle to watch is $34.87, the high of October 22, 2024.
On the other hand, the first downside target of the white metal is seen at $31.79, the low of February 7. The crucial contention level is located at the $31.00-$30.90 region, portraying the round mark and the 100-day EMA. Extended losses below the mentioned level could pave the way to $29.70, the low of January 27.
Silver price (XAG/USD) daily chart
China's new home prices stalled month-on-month in January, official data showed on Wednesday, suggesting the crisis-hit property sector is struggling to stabilise despite continued government efforts to prop up the market.
Prices were unchanged for the second straight month, according to Reuters calculations based on National Bureau of Statistics data. On a year-on-year basis, new home prices fell 5%, narrowing a 5.3% drop the previous month.
Official data from January showed unsold new homes totalled 390.88 million square metres in 2024, marking a 16.2% increase from the previous year. Furthermore, new construction starts, measured by floor area, plummeted 23% annually last year.
Key indicators suggest a sustainable recovery in the property market remains uncertain, according to a research note from Moody's Ratings this week.
"We would expect a more sustainable recovery in property sales should there be positive income expectations, stable or rising property price expectations and lower inventory levels that indicate disciplined supply management," said Moody's Ratings.
Policymakers in the second half of last year ramped up efforts to support China's property market, which fell into a slump in 2021.
The crisis in the sector, triggered by a government-led campaign to rein in property developers' leverage, left many unable to repay debt and complete presold housing units. Home sales have tumbled and confidence sagged.
In the central bank's monetary policy implementation report released last week, the property sector joined the list of key areas marked for more credit support.
Japan’s exports rose at a faster clip in January as businesses ramped up orders just as US President Donald Trump unleashed a barrage of protectionist policies expected to take effect in coming months.
Exports measured by value increased 7.2% from a year earlier led by shipments of cars and ships, the Ministry of Finance reported Wednesday. That compared with the consensus estimate of a 7.7% gain. Shipments to China fell as the lunar new year holidays disrupted trade flows.
Imports surged 16.7% led by communication machinery and computers, and beat the median estimate of a 9.3% increase. Japan’s trade balance swung back into the red, with a deficit of ¥2.76 trillion (US$18.2 billion or RM80.9 billion), the largest in two years.
By region, shipments to the US rose 8.1%, while those to China fell 6.2%. Exports to Europe declined 15.1%.
The global trade outlook is increasingly uncertain. Trump said Tuesday he would likely impose tariffs on automobile, semiconductor and pharmaceutical imports of around 25%, with an announcement coming as soon as April 2.
His fresh tariffs against China already prompted retaliatory levies from Beijing, and the president has also threatened a range of measures against other nations, including 25% levies on steel and aluminum imports that will take effect in March and reciprocal tariffs on numerous trading partners.
Japan, whose two biggest trading partners are the US and China, is bracing for the potential impact and trying to minimise fallout. Tokyo has asked Trump to exclude it from the steel and aluminum steps as well as the reciprocal duties while it also seeks details regarding his other levy plans.
Japan’s longstanding trade surplus with the US continues to risk the ire of Trump, who favours using levies to close trade gaps with other nations. Japan’s trade surplus with the US was ¥477 billion in January. Auto exports to the US surged 21.8% in the month.
White Label
Data API
Web Plug-ins
Poster Maker
Affiliate Program
The risk of loss in trading financial instruments such as stocks, FX, commodities, futures, bonds, ETFs and crypto can be substantial. You may sustain a total loss of the funds that you deposit with your broker. Therefore, you should carefully consider whether such trading is suitable for you in light of your circumstances and financial resources.
No decision to invest should be made without thoroughly conducting due diligence by yourself or consulting with your financial advisors. Our web content might not suit you since we don't know your financial conditions and investment needs. Our financial information might have latency or contain inaccuracy, so you should be fully responsible for any of your trading and investment decisions. The company will not be responsible for your capital loss.
Without getting permission from the website, you are not allowed to copy the website's graphics, texts, or trademarks. Intellectual property rights in the content or data incorporated into this website belong to its providers and exchange merchants.