Markets
News
Analysis
User
24/7
Economic Calendar
Education
Data
- Names
- Latest
- Prev
A:--
F: --
A:--
F: --
P: --
A:--
F: --
P: --
A:--
F: --
P: --
A:--
F: --
P: --
A:--
F: --
P: --
A:--
F: --
P: --
A:--
F: --
P: --
A:--
F: --
P: --
A:--
F: --
P: --
A:--
F: --
P: --
A:--
F: --
P: --
A:--
F: --
P: --
A:--
F: --
P: --
A:--
F: --
P: --
A:--
F: --
A:--
F: --
P: --
A:--
F: --
P: --
A:--
F: --
P: --
A:--
F: --
P: --
A:--
F: --
P: --
A:--
F: --
A:--
F: --
P: --
A:--
F: --
P: --
A:--
F: --
A:--
F: --
P: --
A:--
F: --
P: --
A:--
F: --
P: --
--
F: --
P: --
--
F: --
P: --
--
F: --
P: --
--
F: --
P: --
--
F: --
P: --
--
F: --
P: --
--
F: --
P: --
--
F: --
P: --
--
F: --
P: --
--
F: --
P: --
--
F: --
P: --
--
F: --
P: --
--
F: --
P: --
--
F: --
P: --
--
F: --
P: --
--
F: --
P: --
--
F: --
P: --
--
F: --
P: --
--
F: --
P: --
--
F: --
P: --
--
F: --
P: --
--
F: --
P: --
--
F: --
P: --
--
F: --
P: --
--
F: --
P: --
--
F: --
P: --
--
F: --
P: --
--
F: --
P: --
--
F: --
P: --
--
F: --
P: --
No matching data
Latest Views
Latest Views
Trending Topics
To quickly learn market dynamics and follow market focuses in 15 min.
In the world of mankind, there will not be a statement without any position, nor a remark without any purpose.
Inflation, exchange rates, and the economy shape the policy decisions of central banks; the attitudes and words of central bank officials also influence the actions of market traders.
Money makes the world go round and currency is a permanent commodity. The forex market is full of surprises and expectations.
Top Columnists
Enjoy exciting activities, right here at FastBull.
The latest breaking news and the global financial events.
I have 5 years of experience in financial analysis, especially in aspects of macro developments and medium and long-term trend judgment. My focus is maily on the developments of the Middle East, emerging markets, coal, wheat and other agricultural products.
BeingTrader chief Trading Coach & Speaker, 8+ years of experience in the forex market trading mainly XAUUSD, EUR/USD, GBP/USD, USD/JPY, and Crude Oil. A confident trader and analyst who aims to explore various opportunities and guide investors in the market. As an analyst I am looking to enhance the trader’s experience by supporting them with sufficient data and signals.
Latest Update
Risk Warning on Trading HK Stocks
Despite Hong Kong's robust legal and regulatory framework, its stock market still faces unique risks and challenges, such as currency fluctuations due to the Hong Kong dollar's peg to the US dollar and the impact of mainland China's policy changes and economic conditions on Hong Kong stocks.
HK Stock Trading Fees and Taxation
Trading costs in the Hong Kong stock market include transaction fees, stamp duty, settlement charges, and currency conversion fees for foreign investors. Additionally, taxes may apply based on local regulations.
HK Non-Essential Consumer Goods Industry
The Hong Kong stock market encompasses non-essential consumption sectors like automotive, education, tourism, catering, and apparel. Of the 643 listed companies, 35% are mainland Chinese, making up 65% of the total market capitalization. Thus, it's heavily influenced by the Chinese economy.
HK Real Estate Industry
In recent years, the real estate and construction sector's share in the Hong Kong stock index has notably decreased. Nevertheless, as of 2022, it retains around 10% market share, covering real estate development, construction engineering, investment, and property management.
Hongkong, China
Ho Chi Minh, Vietnam
Dubai, UAE
Lagos, Nigeria
Cairo, Egypt
White Label
Data API
Web Plug-ins
Affiliate Program
View All
No data
Not Logged In
Log in to access more features
FastBull Membership
Not yet
Purchase
Log In
Sign Up
Hongkong, China
Ho Chi Minh, Vietnam
Dubai, UAE
Lagos, Nigeria
Cairo, Egypt
White Label
Data API
Web Plug-ins
Affiliate Program
The Japanese Yen (JPY) attracts some sellers on Friday in reaction to comments from Japan's Finance Minister, Katsunobu Kato, saying that higher long-term rates can pressure Japan's fiscal situation.
The Japanese Yen weakened after Japan's Finance Minister Katsunobu Kato’s comments on Friday.
Japan’s strong National CPI print reaffirms BoJ rate hike bets and should limit losses for the JPY.
The underlying USD bearish sentiment might also contribute to keeping a lid on the USD/JPY pair.
The Japanese Yen (JPY) attracts some sellers on Friday in reaction to comments from Japan's Finance Minister, Katsunobu Kato, saying that higher long-term rates can pressure Japan's fiscal situation. This assists the USD/JPY pair to stage a modest bounce from the 149.30-149.25 region, or its lowest level since December 3 touched during the Asian session. However, any meaningful JPY depreciation still seems elusive in the wake of the growing acceptance that the Bank of Japan (BoJ) would hike interest rates further.
Hawkish BoJ expectations were reaffirmed by Japan's strong National Consumer Price Index (CPI) print and remain supportive of elevated Japanese government bond (JGB) yields. The resultant narrowing of the rate differential between Japan and other countries should continue to underpin the lower-yielding JPY. Apart from this, the recent US Dollar (USD) fall, amid concerns about the US consumer health and despite bets for an extended pause on rates by the Federal Reserve (Fed), might cap the USD/JPY pair.
Japanese Yen drifts lower amid talks of intervention to curb further rise in JGB yields
Japan's Finance Minister, Katsunobu Kato, warned this Friday that higher Japanese government bond yields will increase debt-servicing costs, which, in turn, may impact Japan's finances. This overshadows the stronger-than-expected release of Japan's National Consumer Price Index (CPI) and prompts some intraday selling around the Japanese Yen.
BoJ Governor Kazuo Ueda noted that a rise in long-term interest rates will push up corporate funding costs, but also need to take into account how the improving economy will underpin their profits. If markets make abnormal moves, we stand ready to respond nimbly, such as through market operations to smooth market moves, Ueda added further.
The latest data released by the Statistics Bureau of Japan showed that the headline National CPI climbed to a two-year high of 4.0% YoY in January from 3.6% in the previous month. Meanwhile, the Core CPI, which excludes volatile fresh food items, grew 3.2% from the previous year, compared to 3.0% recorded in December and touching a 19-month high.
Furthermore, a core CPI reading that excludes both fresh food and fuel costs rose 2.5% in January from a year earlier, marking the fastest pace since March 2024. The data underscores rising inflationary pressure in Japan that has drawn hawkish remarks from several BoJ policymakers, which, in turn, should limit any meaningful depreciating move for the JPY.
Moreover, expectations that sustained wage gains could spur consumer spending suggest that the BoJ could hike interest rates more aggressively than initially thought. This keeps the benchmark 10-year JGB yield elevated near its highest level since November 2009 and should continue to act as a tailwind for the lower-yielding JPY in the near term.
A private-sector survey showed that Japan's factory activity extended declines for an eighth straight month in February but at a slower pace. The au Jibun Bank Japan flash Manufacturing Purchasing Managers' Index (PMI) rebounded to 48.9 from a 10-month low of 48.7 in January. In contrast, the gauge for the services sector improved to 53.1 from 53.0.
The US Dollar touched its lowest level since December 10 on Thursday as a softer-than-anticipated sales forecast from Walmart raised doubt over US consumer health. This comes on top of worries that US President Donald Trump's tariff plans and protectionist policies would boost inflation, which could further dent consumer spending.
Meanwhile, Federal Reserve officials remain wary of future interest rate cuts amid sticky inflation and the uncertainty over Trump's policy moves. In fact, St. Louis Fed President Alberto Musalem warned on Thursday that rising inflation expectations combined with the risk of stubborn stagflation could create a double challenge for the US economy.
Earlier, Fed Board Governor Adriana Kugler said that US inflation still has some way to go to reach the 2% target and that its path toward that goal continues to be bumpy. However, Atlanta Fed president Raphael Bostic struck a dovish tone and sees room for two more rate cuts this year, though much depends on the evolving economic conditions.
Traders now look forward to the release of flash US PMIs for fresh insight into the economic health. Friday's US economic docket also features the Existing Home Sales data and the revised Michigan Consumer Sentiment Index. This, along with speeches from FOMC members will drive the USD demand and provide some impetus to the USD/JPY pair.
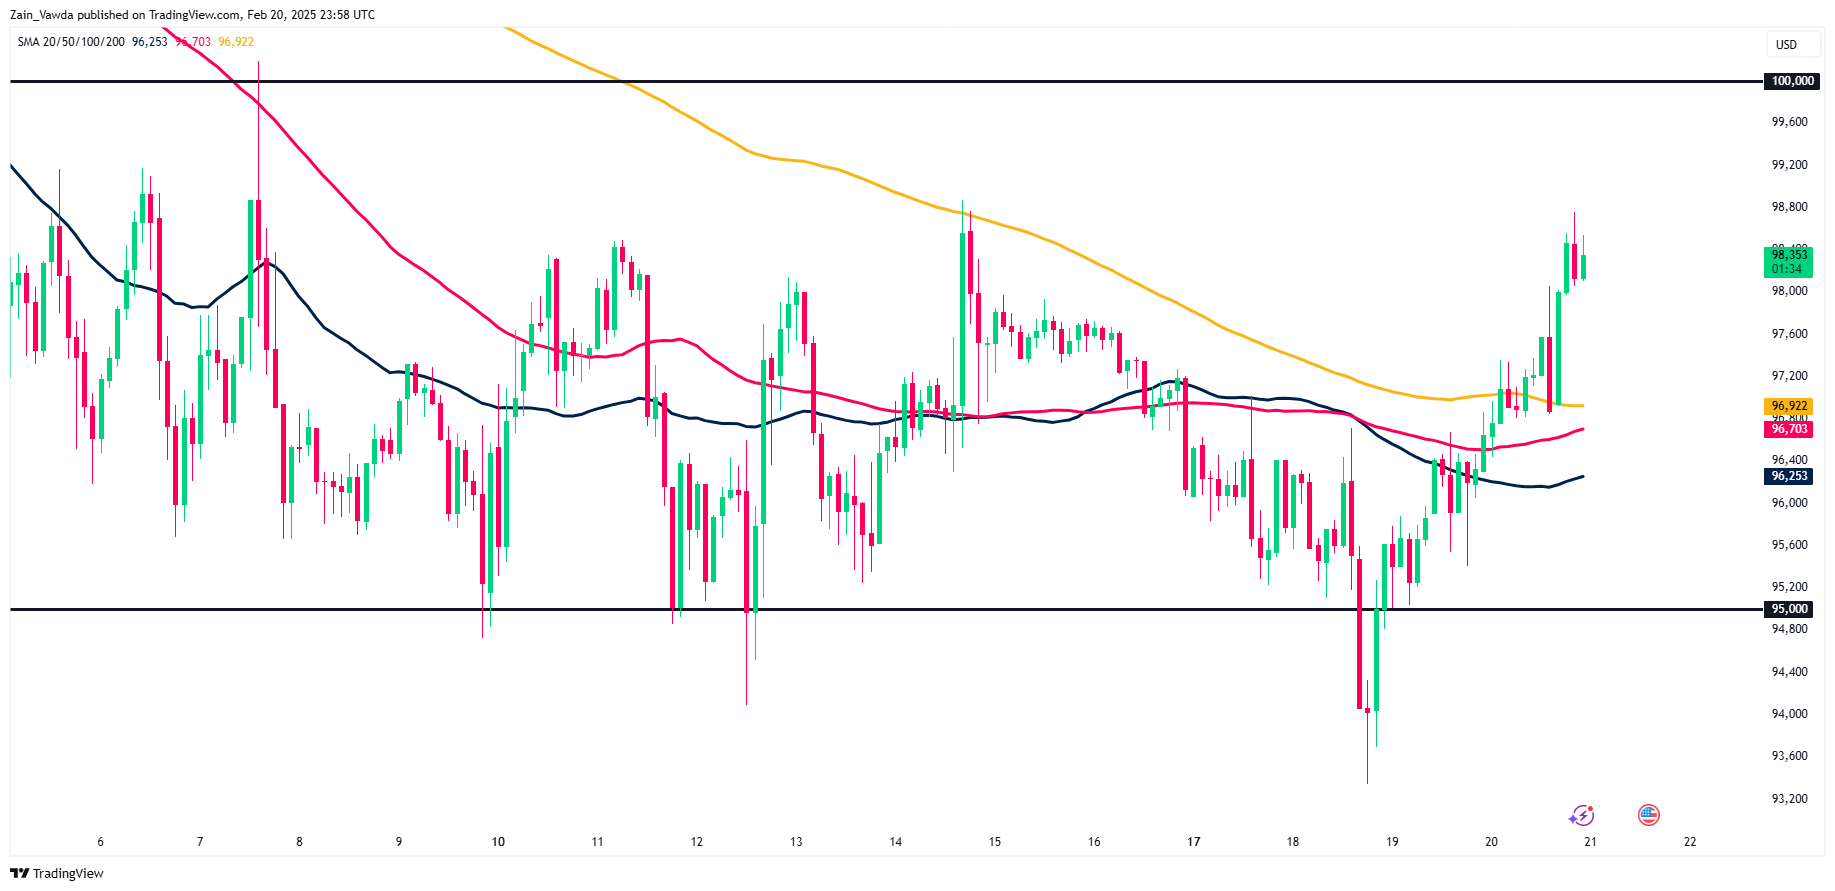
USD/JPY is likely to attract fresh sellers and remain capped near the 150.90-151.00 area
From a technical perspective, the overnight breakdown through the 151.00-150.90 horizontal support and a subsequent fall below the 150.00 psychological mark was seen as a fresh trigger for bearish traders. Moreover, oscillators on the daily chart are holding deep in negative territory and are still away from being in the oversold zone. This, in turn, suggests that the path of least resistance for the USD/JPY pair is to the downside and any further move up could be seen as a selling opportunity near the 151.00 round figure.
Some follow-through buying, however, could trigger a short-covering rally and lift the USD/JPY pair to the 151.40 hurdle en route to the 152.00 round-figure mark. The recovery momentum, however, runs the risk of fizzling out rather quickly near the 152.65 area. The said barrier represents the very important 200-day Simple Moving Average (SMA), which if cleared decisively might shift the near-term bias in favor of bullish traders.
On the flip side, the 150.00 mark now seems to act as an immediate support ahead of the 149.30-149.25 region, or a multi-month low touched during the Asian session. This is closely followed by the 149.00 mark, below which the USD/JPY pair could slide further towards testing the December 2024 swing low, around the 148.65 region.
Bank of Korea Gov. Rhee Chang-yong speaks in this Feb. 18 photo.
The Korean central bank is widely expected to lower its policy rate by 0.25 percentage point next week in an effort to prop up the economy, a poll showed Friday.
According to a survey conducted by Yonhap Infomax, the financial news arm of Yonhap News Agency, 20 out of 21 local analysts and experts polled predicted the Bank of Korea (BOK) will cut its base rate to 2.75 percent from the current 3 percent at its next rate-setting meeting slated for Tuesday.
In January, the BOK kept its benchmark interest rate frozen in the wake of the weak local currency amid political chaos and uncertainties stemming from U.S. President Donald Trump's new administration.
The on-hold decision came on the heels of two rate cuts in the October and November meetings.
"The country is facing growing downside risks centering on weak domestic demand, while the won's further weakness seems limited, which would lead the BOK to lower the policy rate by 25 basis points," said Kim Seon-tae, an expert from KB Kookmin Bank.
Nineteen out of the 21 analysts polled anticipated the key rate to be lowered to 2.5 percent in the first half of this year.
The central bank is scheduled to present an adjusted growth forecast Tuesday. BOK Gov. Rhee Chang-yong has hinted at slashing the outlook to around 1.6 percent from its previous forecast of a 1.9 percent expansion.
Korea's potential growth rate is at 2 percent, and this year may mark the first time ever that the country's yearly growth rate falls below the level.
The Indian Rupee gathers strength in Friday’s Asian session.
Significant US Dollar sales and easing concerns on trade tensions underpin the INR.
The preliminary Indian and US PMI reports for February will be the highlights later on Friday.
The Indian Rupee (INR) gains ground on Friday after reaching a one-week high in the previous session. The massive US Dollar (USD) sales by foreign banks provide some support to the local currency. US President Donald Trump's optimistic comments on a fresh trade deal with China, not only lift the Chinese Yuan but also boost the INR. Any significant depreciation of the Indian Rupee might be limited amid the likely intervention by the Reserve Bank of India (RBI).
Nonetheless, Foreign Portfolio Investment (FPI) outflows and the renewed Greenback demand could weigh on the local currency. The recovery in crude oil prices might also contribute to the INR’s downside as India is the world's third-largest oil consumer.
Traders await the advanced India’s HSBC Purchasing Managers Index (PMI) report for February, which is due later on Friday. On the US docket, the S&P Global PMI, Existing Home Sales and Michigan Consumer Sentiment Index report will be released. Also, the Federal Reserve’s (Fed) Mary Daly and Philip Jefferson are set to speak on the same day.
Indian Rupee strengthens amid easing trade tensions
India's growth is estimated to slow to 6.4% in 2025 from 6.6% in 2024, as new US tariffs and softening global demand weigh on exports, said Moody's Analytics on Thursday.
US President Donald Trump said on Wednesday he will announce fresh tariffs within the next month, adding lumber and forest products to previously announced plans to impose duties on imported cars, semiconductors and pharmaceuticals.
The US Initial Jobless Claims for the week ending February 15 rose to 219,000, compared to the previous week's 214,000 (revised from 213,000), according to the US Department of Labor (DoL) on Thursday. This figure came in above the market consensus of 215K.
Fed Board Governor Adriana Kugler said late Thursday that US inflation still has "some way to go" to reach the central bank's 2% target and that its path toward that goal continues to be bumpy.
St. Louis Fed President Alberto Musalem said the risk of inflation could remain high, adding that he needs confidence that inflation is waning to support more rate cuts.
USD/INR bulls take a breather
The Indian Rupee trades on a stronger note on the day. The USD/INR pair paints the positive picture on the daily chart, with the price holding above the key 100-day Exponential Moving Average (EMA). However, further consolidation or downside cannot be ruled out as the 14-day Relative Strength Index (RSI) stands below the midline near 48.0.
The immediate resistance level for USD/INR emerges at the 87.00 psychological level. Bullish candlesticks and sustained trading above this level could set its sights on an all-time high near 88.00, en route to 88.50.
On the flip side, if the pair can’t hold the line at 86.35, the low of February 12, a drop toward 86.14, the low of January 27, could be on the cards. The next contention level to watch is 85.65, the low of January 7.
Bitcoin (BTC/USD) is holding above $95k but facing significant resistance.
While spot Bitcoin ETFs have attracted substantial investments, there have been recent net outflows, and on-chain data suggests a cooling down in speculative appetite.
Strategy’s potential Bitcoin purchase, following a $2 billion fundraising, could be a catalyst for a future bull run.
Bitcoin has regained momentum after finding support at the key $95k level this week before rising to trade at 98357 at the time of writing. The recent consolidation suggests that Bitcoin could be ready for its next big rally, with a move higher looking appealing once more.
Crypto Heatmap, February 20, 2025
Source: TradingView (click to enlarge)
ETF Flows
Even though Bitcoin’s price fell from its all-time high on January 20, data from CoinShares shows that spot ETFs tied to Bitcoin have still attracted a huge $5.6 billion in new investments.
However, over the last few days we have seen a consistent amount of net outflows with figures of 60.7, 64.1 and 94.6 million USD in net outflows since Tuesday.
Source: Farside Investors
The Week on Chain – Glassnode Data Reveals Downside Risks
Money flowing into the market is slowing down, and trading in derivatives is dropping. The way short-term investors are buying now looks similar to May 2021, which was a tough time for the market.
Overall, in recent weeks markets are seeing the momentum of capital inflows has declined for all digital assets. This signals a meaningful cooling down in speculative appetite and alludes to a potential for capital rotation out of riskier assets on the road ahead.
This is in line with the overall market sentiment at the moment.Although US stock markets continue to hold near highs, the rise of Gold is a clear sign that markets remain nervous as haven demand continues to propel the precious metal to fresh highs.
Momentum in spot markets is slowing down, and less money is going into perpetual futures. This drop in demand has caused a big decline in open interest across major assets, showing less speculative trading and lower profits from cash-and-carry strategies.
The drop in open interest shows that traders are cutting back on risky leveraged bets, likely because the market feels weaker and less certain. The biggest decline is in Memecoins, which usually attract short-term traders but quickly lose popularity when confidence fades.
Source: Glassnode
Microstrategy or ‘Strategy’ Gearing Up for Fresh Buys?
MicroStrategy or as we should get used to calling them, Strategy didn’t buy any Bitcoin last week, keeping its total at 478,740 BTC for the second time.
However, MicroStrategy has hinted at a new Bitcoin purchase with its recent fundraising effort. On February 20, the company announced it had successfully priced a $2 billion offering of 0% convertible notes due in 2030. The deal, set to close on February 21, also gives buyers the option to purchase an extra $300 million in notes.
Will such a purchase prove to be the catalyst for another bull run?
Technical Analysis BTC/USD
Bitcoin (BTC/USD) from a technical standpoint on the daily timeframe sees price eyeing a breakout following a period of consolidation.
The consolidation between 94000 and 100000 has lasted for the last two weeks with Tuesday seeing price dip to a low of 93340 before reclaiming the 95000 handle.
Thursday daily candle did close back above the 100-day MA resting at 97899 but there are significant hurdles ahead. The 50-day MA rests at 99059, just shy of the psychological 100000 level.
Bitcoin (BTC/USD) Daily Chart, February 20, 2024
Source: TradingView.com (click to enlarge)
Dropping down to a two-hour chart and there may be scope for a short term pullback. Significant support rests below current price as we have the 50,100 and 200-day MA converging between the 96000-97000 handles.
This makes this a key area of confluence which could serve as a base for a move toward the 100000 psychological level and beyond.
Immeidate support rests at 97000 before the key 95000 handle comes back into focus.
Resistance rests at 99059 and 100000 before markets will turn their attention toward the 102157 resistance handle.
Bitcoin (BTC/USD) Two-Hour (H2) Chart, February 20, 2024
Support
97000
95000
93200
Resistance
99059
100000
102157
Reserve Bank of New Zealand (RBNZ) Chief Economist Paul Conway noted on Friday, “Official Cash Rate (OCR) forecasts indicate another 75 basis points (bps) easing.”
Additional quotes
New Zealand Dollar (NZD) drop will boost export revenues.
Output gap will help contain inflation pressures.
Weaker NZD will aid economic recovery.
Willing to look through inflation uptick this year.
Lowering OCR below neutral is part of the risk conversation.
Currently sees no prospect of rate increases.
Taking OCR below neutral is not the central projection.
New Zealand Dollar PRICE Today
The table below shows the percentage change of New Zealand Dollar (NZD) against listed major currencies today. New Zealand Dollar was the weakest against the US Dollar.
USD | EUR | GBP | JPY | CAD | AUD | NZD | CHF | |
---|---|---|---|---|---|---|---|---|
USD | 0.16% | 0.11% | 0.50% | 0.09% | 0.15% | 0.10% | 0.18% | |
EUR | -0.16% | -0.04% | 0.33% | -0.07% | -0.01% | -0.06% | 0.02% | |
GBP | -0.11% | 0.04% | 0.40% | -0.02% | 0.04% | -0.02% | 0.07% | |
JPY | -0.50% | -0.33% | -0.40% | -0.36% | -0.31% | -0.38% | -0.29% | |
CAD | -0.09% | 0.07% | 0.02% | 0.36% | 0.05% | 0.00% | 0.08% | |
AUD | -0.15% | 0.00% | -0.04% | 0.31% | -0.05% | -0.05% | 0.02% | |
NZD | -0.10% | 0.06% | 0.02% | 0.38% | -0.01% | 0.05% | 0.08% | |
CHF | -0.18% | -0.02% | -0.07% | 0.29% | -0.08% | -0.02% | -0.08% |
The heat map shows percentage changes of major currencies against each other. The base currency is picked from the left column, while the quote currency is picked from the top row. For example, if you pick the New Zealand Dollar from the left column and move along the horizontal line to the US Dollar, the percentage change displayed in the box will represent NZD (base)/USD (quote).
The Australian Dollar declines as the US Dollar experiences a technical upward correction.
Australia’s Judo Bank Manufacturing PMI increased to 50.6 in February, up from 50.2 in January.
RBA's Bullock warned that an overly rapid or excessive monetary policy easing could hinder the disinflation process.
The Australian Dollar (AUD) edges lower against the US Dollar (USD) following the release of Judo Bank’s Purchasing Managers Index (PMI) on Friday. However, the AUD/USD pair saw gains after US President Donald Trump announced potential progress in trade negotiations with China, easing market concerns over tariffs.
Australia’s Judo Bank Manufacturing PMI rose to 50.6 in February, up from 50.2 in January. The Services PMI improved to 51.4 from 51.2, while the Composite PMI edged up to 51.2 from 51.1.
Reserve Bank of Australia (RBA) Governor Michele Bullock cautioned that easing monetary policy too quickly or excessively could stall disinflation, potentially keeping inflation above the target midpoint. Bullock emphasized the RBA’s commitment to data-driven decisions and careful risk assessment, suggesting that while rate cuts remain a possibility, a cautious approach is necessary.
Australian Dollar appreciated as US Dollar struggled following weak US jobless claims
The US Dollar Index (DXY), which measures the USD against six major currencies, gains ground near 106.50 at the time of writing. However, the DXY faced challenges following weak US jobless claims data and mixed Federal Reserve (Fed) commentary.
US Initial Jobless Claims for the week ending February 14 rose to 219,000, exceeding the expected 215,000. Meanwhile, Continuing Jobless Claims increased to 1.869 million, slightly below the forecast of 1.87 million.
Federal Reserve Board Governor Adriana Kugler stated on Thursday that US inflation still has "some way to go" before reaching the central bank's 2% target, noting that the path remains uncertain, according to Reuters.
St. Louis Fed President Alberto Musalem cautioned about potential stagflation risks and rising inflation expectations. Meanwhile, Atlanta Fed President Raphael Bostic kept the possibility of two rate cuts this year open, contingent on economic developments.
President Trump indicated that a new trade deal with China is possible and expects Chinese President Xi Jinping to visit. He also mentioned discussions with China regarding TikTok and noted that his administration is considering a 25% tariff on lumber and forest products.
The latest Federal Open Market Committee (FOMC) Meeting Minutes reaffirmed the decision to keep interest rates unchanged in January. Policymakers emphasized the need for more time to assess economic activity, labor market trends, and inflation before considering any rate adjustments. The committee also agreed that clear signs of declining inflation are necessary before implementing rate cuts.
President Trump has confirmed that a 25% tariff on pharmaceutical and semiconductor imports will take effect in April. Additionally, he reaffirmed that auto tariffs will remain at 25%, further escalating global trade tensions.
The Australian Bureau of Statistics (ABS) reported on Thursday that Australia’s seasonally adjusted Unemployment Rate rose to 4.1% in January from 4.0% in December, aligning with market expectations. Additionally, Employment Change came in at 44K for January, down from a revised 60K in December (previously 56.3K), but still exceeding the consensus forecast of 20K.
Reserve Bank of Australia (RBA) Deputy Governor Andrew Hauser stated while speaking to Bloomberg News on Thursday that the central bank’s policy “is still restrictive.” Hauser noted that the latest jobs data showed little cause for concern.
The Reserve Bank of Australia (RBA) lowered its Official Cash Rate (OCR) by 25 basis points to 4.10% on Tuesday—the first rate cut in four years. RBA Governor Michele Bullock acknowledged the impact of high interest rates but cautioned that it was too soon to declare victory over inflation. She also emphasized the strength of the labor market and clarified that future rate cuts are not guaranteed, despite market expectations.
Technical Analysis: Australian Dollar tests psychological barrier at 0.6400
The AUD/USD pair hovers around 0.6400 on Friday, trading within an ascending channel that suggests a bullish market sentiment. The 14-day Relative Strength Index (RSI) remains above 50, reinforcing the positive outlook.
On the upside, the AUD/USD pair tests the key psychological resistance at 0.6400, followed by the ascending channel's upper boundary at 0.6420.
Immediate support could be at the nine-day Exponential Moving Average (EMA) of 0.6350, followed by the 14-day EMA at 0.6330. A stronger support zone lies near the channel's lower boundary at 0.6320.
AUD/USD: Daily Chart
Australian Dollar PRICE Today
The table below shows the percentage change of Australian Dollar (AUD) against listed major currencies today. Australian Dollar was the weakest against the US Dollar.
USD | EUR | GBP | JPY | CAD | AUD | NZD | CHF | |
---|---|---|---|---|---|---|---|---|
USD | 0.15% | 0.11% | 0.45% | 0.08% | 0.16% | 0.09% | 0.18% | |
EUR | -0.15% | -0.05% | 0.32% | -0.07% | -0.01% | -0.07% | 0.02% | |
GBP | -0.11% | 0.05% | 0.38% | -0.02% | 0.04% | -0.02% | 0.07% | |
JPY | -0.45% | -0.32% | -0.38% | -0.34% | -0.29% | -0.36% | -0.27% | |
CAD | -0.08% | 0.07% | 0.02% | 0.34% | 0.06% | 0.00% | 0.09% | |
AUD | -0.16% | 0.00% | -0.04% | 0.29% | -0.06% | -0.06% | 0.02% | |
NZD | -0.09% | 0.07% | 0.02% | 0.36% | -0.01% | 0.06% | 0.08% | |
CHF | -0.18% | -0.02% | -0.07% | 0.27% | -0.09% | -0.02% | -0.08% |
The heat map shows percentage changes of major currencies against each other. The base currency is picked from the left column, while the quote currency is picked from the top row. For example, if you pick the Australian Dollar from the left column and move along the horizontal line to the US Dollar, the percentage change displayed in the box will represent AUD (base)/USD (quote).
White Label
Data API
Web Plug-ins
Poster Maker
Affiliate Program
The risk of loss in trading financial instruments such as stocks, FX, commodities, futures, bonds, ETFs and crypto can be substantial. You may sustain a total loss of the funds that you deposit with your broker. Therefore, you should carefully consider whether such trading is suitable for you in light of your circumstances and financial resources.
No decision to invest should be made without thoroughly conducting due diligence by yourself or consulting with your financial advisors. Our web content might not suit you since we don't know your financial conditions and investment needs. Our financial information might have latency or contain inaccuracy, so you should be fully responsible for any of your trading and investment decisions. The company will not be responsible for your capital loss.
Without getting permission from the website, you are not allowed to copy the website's graphics, texts, or trademarks. Intellectual property rights in the content or data incorporated into this website belong to its providers and exchange merchants.