• Trade
  • Markets
  • Copy
  • Contests
  • News
  • 24/7
  • Calendar
  • Q&A
  • Chats
Trending
Screeners
SYMBOL
LAST
BID
ASK
HIGH
LOW
NET CHG.
%CHG.
SPREAD
SPX
S&P 500 Index
6843.26
6843.26
6843.26
6861.30
6840.77
+15.85
+ 0.23%
--
DJI
Dow Jones Industrial Average
48553.76
48553.76
48553.76
48679.14
48544.57
+95.72
+ 0.20%
--
IXIC
NASDAQ Composite Index
23223.08
23223.08
23223.08
23345.56
23210.04
+27.92
+ 0.12%
--
USDX
US Dollar Index
97.800
97.880
97.800
98.070
97.790
-0.150
-0.15%
--
EURUSD
Euro / US Dollar
1.17582
1.17589
1.17582
1.17596
1.17262
+0.00188
+ 0.16%
--
GBPUSD
Pound Sterling / US Dollar
1.33995
1.34002
1.33995
1.34014
1.33546
+0.00288
+ 0.22%
--
XAUUSD
Gold / US Dollar
4324.05
4324.46
4324.05
4350.16
4294.68
+24.66
+ 0.57%
--
WTI
Light Sweet Crude Oil
56.727
56.757
56.727
57.601
56.688
-0.506
-0.88%
--

Community Accounts

Signal Accounts
--
Profit Accounts
--
Loss Accounts
--
View More

Become a signal provider

Sell trading signals to earn additional income

View More

Guide to Copy Trading

Get started with ease and confidence

View More

Signal Accounts for Members

All Signal Accounts

Best Return
  • Best Return
  • Best P/L
  • Best MDD
Past 1W
  • Past 1W
  • Past 1M
  • Past 1Y

All Contests

  • All
  • Trump Updates
  • Recommend
  • Stocks
  • Cryptocurrencies
  • Central Banks
  • Featured News
Top News Only
Share

Ukraine's Top Negotiator: Talks With USA Have Been Constructive And Productive

Share

The Nasdaq Golden Dragon China Index Fell 0.9% In Early Trading

Share

The S&P 500 Opened 32.78 Points Higher, Or 0.48%, At 6860.19; The Dow Jones Industrial Average Opened 136.31 Points Higher, Or 0.28%, At 48594.36; And The Nasdaq Composite Opened 134.87 Points Higher, Or 0.58%, At 23330.04

Share

Miran: Goods Inflation Could Be Settling In At A Higher Level Than Was Normal Before The Pandemic, But That Will Be More Than Offset By Housing Disinflation

Share

Miran, Who Dissented In Favor Of A Larger Cut At Last Fed Meeting, Repeats Keeping Policy Too Tight Will Lead To Job Losses

Share

Miran: Does Not Think Higher Goods Inflation Is Mostly From Tariffs, But Acknowledges Does Not Have A Full Explanation For It

Share

Toronto Stock Index .GSPTSE Rises 67.16 Points, Or 0.21 Percent, To 31594.55 At Open

Share

Miran: Excluding Housing And Non-Market Based Items, Core Pce Inflation May Be Below 2.3%, “Within Noise” Of The Fed's 2% Target

Share

Polish State Assets Minister Balczun Says Jsw Needs Over USD 830 Million Financing To Keep Liquidity For A Year

Share

Miran: Prices Are “Once Again Stable” And Monetary Policy Should Reflect That

Share

Fed's Miran: Current Excess Inflation Is Not Reflective Of Underlying Supply And Demand In The Economy

Share

Portugal Treasury Puts 2026 Net Financing Needs At 13 Billion Euros, Up From 10.8 Billion In 2025

Share

Portugal Treasury Expects 2026 Net Financing Needs At 29.4 Billion Euros, Up From 25.8 Billion In 2025

Share

Bank Of America Says With Indonesia's Smelter Now Ramping Up, It Expects Aluminium Supply Growth To Accelerate To 2.6% Year On Year In 2026

Share

Bank Of America Expects A Deficit In Aluminium Next Year And Sees Prices Pushing Above $3000/T

Share

Fed Data - USA Effective Federal Funds Rate At 3.64 Percent On 12 December On $102 Billion In Trades Versus 3.64 Percent On $99 Billion On 11 December

Share

Brazil's Petrobras Says No Impact Seen On Oil, Petroleum Products Output As Workers Start Planned Strike

Share

Statement: US Travel Group Warns New Proposed Trump Administration Requirements For Foreign Tourists To Provide Social Media Histories Could Mean Millions Of People Opting Not To Visit

Share

Blackrock: Kerry White Will Become Head Of Citi Investment Management At Citi Wealth

Share

Blackrock: Rob Jasminski, Head Of Citi Investment Management, Has Joined With Team

TIME
ACT
FCST
PREV
Japan Tankan Large Non-Manufacturing Outlook Index (Q4)

A:--

F: --

P: --

Japan Tankan Large Manufacturing Outlook Index (Q4)

A:--

F: --

P: --

Japan Tankan Small Manufacturing Diffusion Index (Q4)

A:--

F: --

P: --

Japan Tankan Large Manufacturing Diffusion Index (Q4)

A:--

F: --

P: --

Japan Tankan Large-Enterprise Capital Expenditure YoY (Q4)

A:--

F: --

P: --

U.K. Rightmove House Price Index YoY (Dec)

A:--

F: --

P: --

China, Mainland Industrial Output YoY (YTD) (Nov)

A:--

F: --

P: --

China, Mainland Urban Area Unemployment Rate (Nov)

A:--

F: --

P: --

Saudi Arabia CPI YoY (Nov)

A:--

F: --

P: --

Euro Zone Industrial Output YoY (Oct)

A:--

F: --

P: --

Euro Zone Industrial Output MoM (Oct)

A:--

F: --

P: --

Canada Existing Home Sales MoM (Nov)

A:--

F: --

P: --

Canada National Economic Confidence Index

A:--

F: --

P: --

Canada New Housing Starts (Nov)

A:--

F: --

P: --
U.S. NY Fed Manufacturing Employment Index (Dec)

A:--

F: --

P: --

U.S. NY Fed Manufacturing Index (Dec)

A:--

F: --

P: --

Canada Core CPI YoY (Nov)

A:--

F: --

P: --

Canada Manufacturing Unfilled Orders MoM (Oct)

A:--

F: --

P: --

U.S. NY Fed Manufacturing Prices Received Index (Dec)

A:--

F: --

P: --

U.S. NY Fed Manufacturing New Orders Index (Dec)

A:--

F: --

P: --

Canada Manufacturing New Orders MoM (Oct)

A:--

F: --

P: --

Canada Core CPI MoM (Nov)

A:--

F: --

P: --

Canada Trimmed CPI YoY (SA) (Nov)

A:--

F: --

P: --

Canada Manufacturing Inventory MoM (Oct)

A:--

F: --

P: --

Canada CPI YoY (Nov)

A:--

F: --

P: --

Canada CPI MoM (Nov)

A:--

F: --

P: --

Canada CPI YoY (SA) (Nov)

A:--

F: --

P: --

Canada Core CPI MoM (SA) (Nov)

A:--

F: --

P: --

Canada CPI MoM (SA) (Nov)

A:--

F: --

P: --

Federal Reserve Board Governor Milan delivered a speech
U.S. NAHB Housing Market Index (Dec)

--

F: --

P: --

Australia Composite PMI Prelim (Dec)

--

F: --

P: --

Australia Services PMI Prelim (Dec)

--

F: --

P: --

Australia Manufacturing PMI Prelim (Dec)

--

F: --

P: --

Japan Manufacturing PMI Prelim (SA) (Dec)

--

F: --

P: --

U.K. 3-Month ILO Employment Change (Oct)

--

F: --

P: --

U.K. Unemployment Claimant Count (Nov)

--

F: --

P: --

U.K. Unemployment Rate (Nov)

--

F: --

P: --

U.K. 3-Month ILO Unemployment Rate (Oct)

--

F: --

P: --

U.K. Average Weekly Earnings (3-Month Average, Including Bonuses) YoY (Oct)

--

F: --

P: --

U.K. Average Weekly Earnings (3-Month Average, Excluding Bonuses) YoY (Oct)

--

F: --

P: --

France Services PMI Prelim (Dec)

--

F: --

P: --

France Composite PMI Prelim (SA) (Dec)

--

F: --

P: --

France Manufacturing PMI Prelim (Dec)

--

F: --

P: --

Germany Services PMI Prelim (SA) (Dec)

--

F: --

P: --

Germany Manufacturing PMI Prelim (SA) (Dec)

--

F: --

P: --

Germany Composite PMI Prelim (SA) (Dec)

--

F: --

P: --

Euro Zone Composite PMI Prelim (SA) (Dec)

--

F: --

P: --

Euro Zone Services PMI Prelim (SA) (Dec)

--

F: --

P: --

Euro Zone Manufacturing PMI Prelim (SA) (Dec)

--

F: --

P: --

U.K. Services PMI Prelim (Dec)

--

F: --

P: --

U.K. Manufacturing PMI Prelim (Dec)

--

F: --

P: --

U.K. Composite PMI Prelim (Dec)

--

F: --

P: --

Euro Zone ZEW Economic Sentiment Index (Dec)

--

F: --

P: --

Germany ZEW Current Conditions Index (Dec)

--

F: --

P: --

Germany ZEW Economic Sentiment Index (Dec)

--

F: --

P: --

Euro Zone Trade Balance (Not SA) (Oct)

--

F: --

P: --

Euro Zone ZEW Current Conditions Index (Dec)

--

F: --

P: --

Euro Zone Trade Balance (SA) (Oct)

--

F: --

P: --

U.S. Retail Sales MoM (Excl. Automobile) (SA) (Oct)

--

F: --

P: --

Q&A with Experts
    • All
    • Chatrooms
    • Groups
    • Friends
    Connecting
    .
    .
    .
    Type here...
    Add Symbol or Code

      No matching data

      All
      Trump Updates
      Recommend
      Stocks
      Cryptocurrencies
      Central Banks
      Featured News
      • All
      • Russia-Ukraine Conflict
      • Middle East Flashpoint
      • All
      • Russia-Ukraine Conflict
      • Middle East Flashpoint
      Search
      Products

      Charts Free Forever

      Chats Q&A with Experts
      Screeners Economic Calendar Data Tools
      Membership Features
      Data Warehouse Market Trends Institutional Data Policy Rates Macro

      Market Trends

      Market Sentiment Order Book Forex Correlations

      Top Indicators

      Charts Free Forever
      Markets

      News

      News Analysis 24/7 Columns Education
      From Institutions From Analysts
      Topics Columnists

      Latest Views

      Latest Views

      Trending Topics

      Top Columnists

      Latest Update

      Signals

      Copy Rankings Latest Signals Become a signal provider AI Rating
      Contests
      Brokers

      Overview Brokers Assessment Rankings Regulators News Claims
      Broker listing Forex Brokers Comparison Tool Live Spread Comparison Scam
      Q&A Complaint Scam Alert Videos Tips to Detect Scam
      More

      Business
      Events
      Careers About Us Advertising Help Center

      White Label

      Data API

      Web Plug-ins

      Affiliate Program

      Awards Institution Evaluation IB Seminar Salon Event Exhibition
      Vietnam Thailand Singapore Dubai
      Fans Party Investment Sharing Session
      FastBull Summit BrokersView Expo
      Recent Searches
        Top Searches
          Markets
          News
          Analysis
          User
          24/7
          Economic Calendar
          Education
          Data
          • Names
          • Latest
          • Prev

          View All

          No data

          Scan to Download

          Faster Charts, Chat Faster!

          Download App
          English
          • English
          • Español
          • العربية
          • Bahasa Indonesia
          • Bahasa Melayu
          • Tiếng Việt
          • ภาษาไทย
          • Français
          • Italiano
          • Türkçe
          • Русский язык
          • 简中
          • 繁中
          Open Account
          Search
          Products
          Charts Free Forever
          Markets
          News
          Signals

          Copy Rankings Latest Signals Become a signal provider AI Rating
          Contests
          Brokers

          Overview Brokers Assessment Rankings Regulators News Claims
          Broker listing Forex Brokers Comparison Tool Live Spread Comparison Scam
          Q&A Complaint Scam Alert Videos Tips to Detect Scam
          More

          Business
          Events
          Careers About Us Advertising Help Center

          White Label

          Data API

          Web Plug-ins

          Affiliate Program

          Awards Institution Evaluation IB Seminar Salon Event Exhibition
          Vietnam Thailand Singapore Dubai
          Fans Party Investment Sharing Session
          FastBull Summit BrokersView Expo

          Can Teladoc (TDOC) Q2 Earnings Navigate BetterHelp Profit Woes?

          Zacks
          Teladoc Health
          -0.79%

          Teladoc Health, Inc. TDOC is set to report its second-quarter 2024 results on Jul 31, after the closing bell.

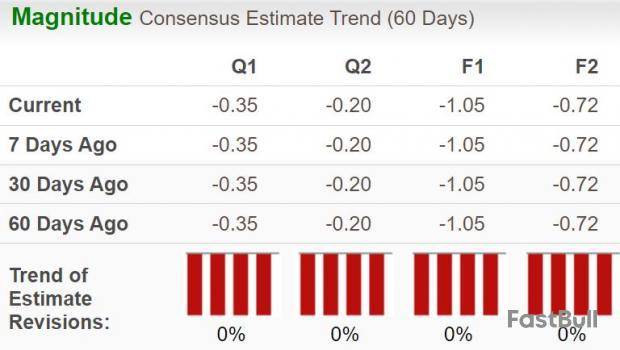
          The Zacks Consensus Estimate for second-quarter earnings is currently pegged at a loss of 35 cents per share, implying an improvement of 12.5% from the year-ago reported number. The estimate remained stable over the past week. The Zacks Consensus Estimate for second-quarter revenues is currently pegged at $649.6 million, suggesting a 0.4% fall from the year-ago actuals.

          Zacks Investment Research
          Zacks

          TDOC beat the consensus estimate for earnings in three of the trailing four quarters and missed once, with the average surprise being 8.2%, as you can see below.

          Teladoc Health, Inc. Price and EPS Surprise

          Teladoc Health, Inc. price-eps-surprise | Teladoc Health, Inc. Quote

          Q2 Earnings Whispers

          Our proven model does not conclusively predict an earnings beat for Teladoc this time around. The combination of a positive Earnings ESP and a Zacks Rank #1 (Strong Buy), 2 (Buy) or 3 (Hold) increases the chances of an earnings beat. That is not the case here, as you will see below.

          Earnings ESP: The company has an Earnings ESP of 0.00%. This is because the Most Accurate Estimate currently stands at a loss of 35 cents per share, in line with the Zacks Consensus Estimate.

          You can uncover the best stocks to buy or sell before they’re reported with our Earnings ESP Filter.

          Zacks Rank: Teladoc currently carries a Zacks Rank #4 (Sell).

          Now, let’s see how things have shaped up before the second-quarter earnings announcement.

          Q2 Factors to Note

          Teladoc’s second-quarter results are likely to have gained from higher visits, U.S. Integrated Care members and lower expenses. We expect BetterHelp paying users to have decreased in the quarter under review.

          For the second quarter, the consensus mark indicates a 10% year-over-year increase in total visits. Both the Zacks Consensus Estimate and our estimate for U.S. Integrated Care members for the second quarter indicate a more than 7% increase from the year-ago period.

          Both the Zacks Consensus Estimate and our estimate for international revenues indicate a nearly 3% increase from the year-ago period. The Zacks Consensus Estimate for other revenues is pegged at $84.8 million, suggesting a 10.5% increase from the year-ago figure.

          Our model indicates that total expenses are expected to have declined nearly 1% in the quarter, primarily due to lower technology and development costs, advertising and marketing, and general and administrative costs. We expect advertising and marketing expenses to have dropped more than 6% in the second quarter. This is likely to have aided the bottom line.

          However, both the Zacks Consensus Estimate and our estimate for second-quarter Access Fees revenues indicate a nearly 2% decrease from the prior-year quarter’s tally of $575.7 million. Both the Zacks Consensus Estimate and our estimate for U.S. revenues for the second quarter suggest a 1.2% year-over-year decline. These are likely to have affected TDOC’s top line in the quarter under review.

          The Zacks Consensus Estimate for BetterHelp paying users for the second quarter suggests a more than 11% decline from a year ago, whereas our model estimate indicates a more than 10% fall. The consensus mark for adjusted EBITDA from BetterHelp indicates a 25.5% year-over-year fall in the second quarter, while our model estimate suggests a 21% decline. The expected weakness in BetterHelp’s performance makes an earnings beat uncertain.

          Previously, at the first-quarter earnings release, management stated that it expects total revenues of $635-$660 million and an adjusted EBITDA of $70-$80 million for the second quarter of 2023. U.S. Integrated Care Members were forecasted to stay within 92-93 million.

          Price Performance

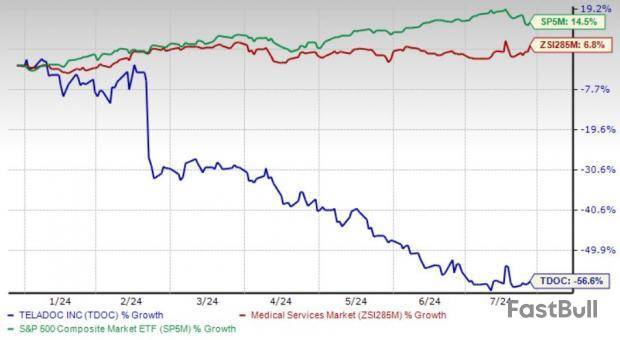
          Teladoc's stock has lost 56.6% in the year-to-date period against the industry’s growth of 6.8%. Additionally, the stock underperformed the S&P 500 Index, which rallied 14.5% during the same period.

          YTD Price Performance

          Zacks Investment Research
          Zacks

          What Should Investors Do Now?

          Rising competition in the virtual care space, an expected decline in revenues and its unprofitable operations are major concerns for the stock. It can’t bank on earnings solely to service its debt obligations. The massive decline in share price this year indicates investors’ waning confidence in the stock. Given these headwinds, TDOC appears to be a risky investment in the short run. Exiting the stock may be a prudent decision for investors looking to mitigate potential risks.

          Stocks to Consider

          While an earnings beat looks uncertain for Teladoc, here are some companies from the broader Medical space that you may want to consider, as our model shows that these have the right combination of elements to post an earnings beat this time around:

          Enhabit, Inc. EHAB has an Earnings ESP of +63.64% and a Zacks Rank of 2. You can see the complete list of today’s Zacks #1 Rank stocks here.

          The Zacks Consensus Estimate for Enhabit’s bottom line for the to-be-reported quarter is pegged at 6 cents per share, which increased by a penny over the past week. The estimate signals 50% year-over-year growth. The consensus estimate for EHAB’s revenues is pegged at $266 million, indicating a 1.4% increase from a year ago.

          BrightSpring Health Services, Inc. BTSG has an Earnings ESP of +89.50% and is a Zacks #2 Ranked player.

          The Zacks Consensus Estimate for BrightSpring’s bottom line for the to-be-reported quarter is pegged at 18 cents per share, which remained stable over the past week. The consensus estimate for BTSG’s revenues is pegged at $2.6 billion.

          Natera, Inc. NTRA has an Earnings ESP of +14.90% and a Zacks Rank of 3.

          The Zacks Consensus Estimate for Natera's bottom line for the to-be-reported quarter suggests a 28.9% year-over-year improvement. The estimate remained stable over the past week. The consensus estimate for NTRA’s revenues is pegged at $340.1 million, suggesting a 30.1% increase from the year-ago period.

          Stay on top of upcoming earnings announcements with the Zacks Earnings Calendar.

          Zacks Investment Research

          Risk Warnings and Disclaimers
          You understand and acknowledge that there is a high degree of risk involved in trading. Following any strategies or investment methods may lead to potential losses. The content on the site is provided by our contributors and analysts for information purposes only. You are solely responsible for determining whether any trading assets, securities, strategy, or any other product is suitable for investing based on your own investment objectives and financial situation.
          Add to Favorites
          Share

          Countdown to Teladoc (TDOC) Q2 Earnings: Wall Street Forecasts for Key Metrics

          Zacks
          Teladoc Health
          -0.79%

          In its upcoming report, Teladoc is predicted by Wall Street analysts to post quarterly loss of $0.35 per share, reflecting an increase of 12.5% compared to the same period last year. Revenues are forecasted to be $649.56 million, representing a year-over-year decrease of 0.4%.

          The consensus EPS estimate for the quarter has remained unchanged over the last 30 days. This reflects how the analysts covering the stock have collectively reevaluated their initial estimates during this timeframe.

          Before a company reveals its earnings, it is vital to take into account any changes in earnings projections. These revisions play a pivotal role in predicting the possible reactions of investors toward the stock. Multiple empirical studies have consistently shown a strong association between trends in earnings estimates and the short-term price movements of a stock.

          While investors typically use consensus earnings and revenue estimates as indicators of quarterly business performance, exploring analysts' projections for specific key metrics can offer valuable insights.

          Given this perspective, it's time to examine the average forecasts of specific Teladoc metrics that are routinely monitored and predicted by Wall Street analysts.

          Analysts predict that the 'Revenues by Segment- BetterHelp' will reach $273.85 million. The estimate points to a change of -6.3% from the year-ago quarter.

          It is projected by analysts that the 'Revenues by Segment- Teladoc Health Integrated Care' will reach $374.76 million. The estimate indicates a year-over-year change of +4.1%.

          The combined assessment of analysts suggests that 'Revenues by Segment- BetterHelp- Therapy Services' will likely reach $269.86 million. The estimate indicates a year-over-year change of -6.4%.

          The collective assessment of analysts points to an estimated 'Revenues by Segment- BetterHelp- Other Wellness Services' of $5.16 million. The estimate indicates a change of +26.8% from the prior-year quarter.

          Analysts expect 'Revenue by Type- Access fees' to come in at $564.53 million. The estimate indicates a change of -1.9% from the prior-year quarter.

          The average prediction of analysts places 'Revenue by Type- Other' at $84.83 million. The estimate suggests a change of +10.5% year over year.

          Based on the collective assessment of analysts, 'U.S. Integrated Care Members' should arrive at 92.39 million. The estimate is in contrast to the year-ago figure of 85.9 million.

          Analysts' assessment points toward 'Visits' reaching 5,171,145. The estimate compares to the year-ago value of 4,700,000.

          The consensus estimate for 'Adjusted EBITDA- BetterHelp' stands at $25.48 million. The estimate compares to the year-ago value of $34.19 million.

          The consensus among analysts is that 'Adjusted EBITDA- Teladoc Health Integrated Care' will reach $50.25 million. Compared to the current estimate, the company reported $37.97 million in the same quarter of the previous year.

          View all Key Company Metrics for Teladoc here>>>

          Shares of Teladoc have demonstrated returns of -4.2% over the past month compared to the Zacks S&P 500 composite's -0.2% change. With a Zacks Rank #4 (Sell), TDOC is expected to lag the overall market performance in the near future. You can see the complete list of today's Zacks Rank #1 (Strong Buy) stocks here

          Zacks Investment Research

          Risk Warnings and Disclaimers
          You understand and acknowledge that there is a high degree of risk involved in trading. Following any strategies or investment methods may lead to potential losses. The content on the site is provided by our contributors and analysts for information purposes only. You are solely responsible for determining whether any trading assets, securities, strategy, or any other product is suitable for investing based on your own investment objectives and financial situation.
          Add to Favorites
          Share

          Apple, Amazon, Microsoft, Meta Lead The Charge As Investors Bank On Tech Cheer For Rally's Reacceleration: Week Ahead In Earnings

          Benzinga
          Tesla
          +4.31%
          Alphabet-C
          -0.18%
          Alphabet-A
          -0.15%
          Alphabet-C
          -0.18%
          Alphabet-A
          -0.15%

          The earnings reports of last week were a mixed bag, with some Tesla, Inc. , Alphabet, Inc. and STMicroelectronics N.V. , among companies disappointing to the downside. As the focus shifts to the unfolding week, more tech companies are lined up to disclose their quarterly results, potentially offering cues regarding the health of the sector.

          The Week That Was: Most on Wall Street viewed Tesla’s earnings as lacking quality because a significant portion of them came from one-time regulatory credits. On the other hand, Google-parent Alphabet alienated investors by flagging higher capex that will likely weigh down on margins and in turn the bottom line.

          Franco-Italian chipmaker, which is a key supplier to the automotive market, cut its full-year guidance. But not all tech tidings were received with pessimism. International Business Machines Co. rose as investors cheered the company’s strong artificial intelligence bookings.

          Healthy Trend: Data from financial data analytics company FactSet showed that about 14% of the S&P 500 companies have reported their quarterly results so far. The percentage of S&P 500 names that reported upside earnings surprise is 80%, above the one-year average (78%), five-year average (77%), and 10-year average (74%). But the percentage of upside was sub-part at 5.5%, below the one-year average (+6.5%), five-year average (+8.6%), and 10-year average (+6.8%).

          The blended earnings of S&P 500 companies are expected to grow by 9.7%, the fastest pace since the fourth quarter of 2021. Eight of the 11 S&P 500 companies are on track to report year-over-year earnings growth for the June quarter, with communication Services, healthcare, IT, and financials likely reporting double-digit growth.

          On the other hand, the materials space is expected to witness the steepest earnings decline.

          See Also: Best Tech Stocks Right Now

          The Week Ahead: According to FactSet, this week will feature earnings reports from 138 S&P 500 companies, including seven components of the Dow 30. Some heavily-weighted companies such as Apple, Inc. , Microsoft Corp. and Meta Platforms, Inc. are all in the mix.

          Meta is expected to be the largest contributor to earnings per share growth, given the consensus models nearly 60% increase.

          After last week’s brutal tech sell-off, a bullish analyst is optimistic concerning the the sector, its prospects and the stock trajectory. “We believe the tech sell-off seen last week will be short-lived as the Street better digests results and commentary from the broader tech sector over the coming weeks during 2Q earnings season,” Wedbush’s Daniel Ives said in a note published Sunday.

          “This is the start....not the end of this tech bull run we expect the next few years,” he said, adding that companies, utilities,

          governments will spend over $1 trillion combined in AI capex over the coming years fueling this AI Revolution.

          The analyst said investors will likely look for clues around the pace of AI revolution from the earnings reports of Microsoft, Amazon, Inc. , Meta and Apple and others.

          Tech stocks extended their weekly declines in the week ended July 26 amid the disappointment from early tech reporters. The Invesco QQQ Trust , an index that tracks the performance of the Nasdaq 100 Index, ended Friday’s session down 1.03% to $462.97, according to Benzinga Pro data. The ETF is trading off its record close of $502.96 reached on July 10. The SPDR S&P 500 ETF Trust climbed 1.12% on Friday before closing at $5544.44. The QQQ and SPY climbed 0.48% and 0.25%, respectively, in premarket trading Monday.

          Notable among the companies reporting this week are:

          Monday

          Before market open:

          • McDonald’s Corporation 
          • ON Semiconductor Corporation 

          After close:

          • F5, Inc.
          • Rambus Inc.
          • Lattice Semiconductor Corporation
          • Chesapeake Energy Corporation
          • Sanmina Corporation
          • Tilray Brands, Inc.

          Tuesday

          Before market open:

          • American Electric Power Company, Inc.
          • Archer-Daniels-Midland Company
          • BP p.l.c.
          • Illinois Tool Works Inc.
          • JetBlue Airways Corporation
          • LGI Homes, Inc.
          • Logitech International S.A.
          • Merck & Co., Inc.
          • PayPal Holdings, Inc.
          • Pfizer Inc.
          • Procter & Gamble Company
          • Restaurant Brands International Inc.
          • SoFi Technologies, Inc.

          After close:

          • Advanced Micro Devices, Inc.
          • Arista Networks, Inc.
          • Caesars Entertainment, Inc.
          • DoubleVerify Holdings, Inc.
          • Electronic Arts Inc.
          • First Solar, Inc.
          • Freshworks Inc.
          • Live Nation Entertainment, Inc.
          • Match Group, Inc.
          • Microsoft
          • Mondelez International, Inc.
          • Pinterest, Inc.
          • Skyworks Solutions, Inc.
          • Starbucks Corporation
          • Qorvo, Inc.

          Wednesday

          Before market open:

          • Altria Group, Inc.
          • AutoNation, Inc.
          • Barrick Gold Corporation
          • Bausch + Lomb Corporation
          • Boeing Company
          • DuPont de Nemours, Inc.
          • Garmin Ltd.
          • GSK plc
          • Humana Inc.
          • KKR & Co. Inc.
          • Kraft Heinz Company
          • Oshkosh Corporation
          • Teva Pharmaceutical Industries Limited
          • Marriott International, Inc.
          • Wingstop Inc.
          • T-Mobile US, Inc.
          • Norwegian Cruise Line Holdings Ltd.

          After close:

          • Albemarle Corporation
          • American International Group, Inc.
          • Arm Holdings plc
          • C.H. Robinson Worldwide, Inc.
          • Carvana Co.
          • eBay Inc.
          • Etsy, Inc.
          • Host Hotels & Resorts, Inc.
          • Lam Research Corporation
          • Meta
          • MGM Resorts International
          • NETGEAR, Inc.
          • QUALCOMM Incorporated
          • Teladoc Health, Inc.
          • Western Union Company

          Thursday

          Before market open:

          • Anheuser-Busch InBev SA/NV
          • Bausch Health Companies Inc.
          • Biogen Inc.
          • ConocoPhillips
          • Dominion Energy, Inc.
          • EVgo, Inc.
          • Hershey Company
          • Hertz Global Holdings, Inc.
          • Mobileye Global Inc.
          • Regeneron Pharmaceuticals, Inc.
          • Sirius XM Holdings Inc.
          • Cigna Group
          • Wayfair Inc.

          After close:

          • Amazon
          • Apple
          • Beazer Homes USA, Inc.
          • BigBear.ai Holdings, Inc.
          • Block, Inc.
          • Booking Holdings Inc.
          • Cloudflare, Inc.
          • Clorox Company
          • Coinbase Global, Inc.
          • DraftKings Inc.
          • Intel Corporation
          • Microchip Technology Incorporated
          • MicroStrategy Incorporated
          • Opendoor Technologies Inc.
          • RingCentral, Inc.
          • Roku, Inc.
          • Vertex Pharmaceuticals Incorporated
          • Twilio Inc.
          • United States Steel Corporation

          Friday

          Before market open:

          • Chevron Corporation
          • Exxon Mobil Corporation
          • Magna International Inc.
          • Cinemark Holdings, Inc.
          • Fluor Corporation

          After close:

          • AMC Entertainment Holdings, Inc.

          Read Next:

          • Alphabet Investors Fret Over Margin Impact Of Higher AI-related Capex, But Fund Manager Says Not Spending Enough Exposes Google’s Parent To Risk Of ‘Losing Their Grip On The Future’

          Image via Shutterstock

          © 2024 Benzinga.com. Benzinga does not provide investment advice. All rights reserved.

          Risk Warnings and Disclaimers
          You understand and acknowledge that there is a high degree of risk involved in trading. Following any strategies or investment methods may lead to potential losses. The content on the site is provided by our contributors and analysts for information purposes only. You are solely responsible for determining whether any trading assets, securities, strategy, or any other product is suitable for investing based on your own investment objectives and financial situation.
          Add to Favorites
          Share

          Nyse Order Imbalance 190126.0 Shares On Buy Side

          Reuters
          Teladoc Health
          -0.79%
          Risk Warnings and Disclaimers
          You understand and acknowledge that there is a high degree of risk involved in trading. Following any strategies or investment methods may lead to potential losses. The content on the site is provided by our contributors and analysts for information purposes only. You are solely responsible for determining whether any trading assets, securities, strategy, or any other product is suitable for investing based on your own investment objectives and financial situation.
          Add to Favorites
          Share

          Nyse Order Imbalance 61617.0 Shares On Buy Side

          Reuters
          Teladoc Health
          -0.79%
          Risk Warnings and Disclaimers
          You understand and acknowledge that there is a high degree of risk involved in trading. Following any strategies or investment methods may lead to potential losses. The content on the site is provided by our contributors and analysts for information purposes only. You are solely responsible for determining whether any trading assets, securities, strategy, or any other product is suitable for investing based on your own investment objectives and financial situation.
          Add to Favorites
          Share

          Teladoc (TDOC) Ascends While Market Falls: Some Facts to Note

          Zacks
          Teladoc Health
          -0.79%

          The latest trading session saw Teladoc ending at $9.30, denoting a +1.2% adjustment from its last day's close. The stock outperformed the S&P 500, which registered a daily loss of 0.16%. At the same time, the Dow lost 0.14%, and the tech-heavy Nasdaq lost 0.06%.

          The the stock of telehealth services provider has fallen by 11.29% in the past month, lagging the Medical sector's gain of 0.37% and the S&P 500's gain of 1.96%.

          The investment community will be closely monitoring the performance of Teladoc in its forthcoming earnings report. The company is scheduled to release its earnings on July 31, 2024. On that day, Teladoc is projected to report earnings of -$0.35 per share, which would represent year-over-year growth of 12.5%. Alongside, our most recent consensus estimate is anticipating revenue of $649.56 million, indicating a 0.44% downward movement from the same quarter last year.

          For the annual period, the Zacks Consensus Estimates anticipate earnings of -$1.05 per share and a revenue of $2.65 billion, signifying shifts of +21.64% and +1.8%, respectively, from the last year.

          Any recent changes to analyst estimates for Teladoc should also be noted by investors. These revisions help to show the ever-changing nature of near-term business trends. With this in mind, we can consider positive estimate revisions a sign of optimism about the company's business outlook.

          Our research reveals that these estimate alterations are directly linked with the stock price performance in the near future. To utilize this, we have created the Zacks Rank, a proprietary model that integrates these estimate changes and provides a functional rating system.

          The Zacks Rank system, running from #1 (Strong Buy) to #5 (Strong Sell), holds an admirable track record of superior performance, independently audited, with #1 stocks contributing an average annual return of +25% since 1988. Within the past 30 days, our consensus EPS projection remained stagnant. At present, Teladoc boasts a Zacks Rank of #4 (Sell).

          The Medical Services industry is part of the Medical sector. With its current Zacks Industry Rank of 98, this industry ranks in the top 39% of all industries, numbering over 250.

          The Zacks Industry Rank gauges the strength of our industry groups by measuring the average Zacks Rank of the individual stocks within the groups. Our research shows that the top 50% rated industries outperform the bottom half by a factor of 2 to 1.

          Be sure to follow all of these stock-moving metrics, and many more, on Zacks.com.

          Zacks Investment Research

          Risk Warnings and Disclaimers
          You understand and acknowledge that there is a high degree of risk involved in trading. Following any strategies or investment methods may lead to potential losses. The content on the site is provided by our contributors and analysts for information purposes only. You are solely responsible for determining whether any trading assets, securities, strategy, or any other product is suitable for investing based on your own investment objectives and financial situation.
          Add to Favorites
          Share

          Nyse Order Imbalance 214223.0 Shares On Buy Side

          Reuters
          Teladoc Health
          -0.79%
          Risk Warnings and Disclaimers
          You understand and acknowledge that there is a high degree of risk involved in trading. Following any strategies or investment methods may lead to potential losses. The content on the site is provided by our contributors and analysts for information purposes only. You are solely responsible for determining whether any trading assets, securities, strategy, or any other product is suitable for investing based on your own investment objectives and financial situation.
          Add to Favorites
          Share
          FastBull
          Copyright © 2025 FastBull Ltd

          728 RM B 7/F GEE LOK IND BLDG NO 34 HUNG TO RD KWUN TONG KLN HONG KONG

          TelegramInstagramTwitterfacebooklinkedin
          App Store Google Play Google Play
          Products
          Charts

          Chats

          Q&A with Experts
          Screeners
          Economic Calendar
          Data
          Tools
          Membership
          Features
          Function
          Markets
          Copy Trading
          Latest Signals
          Contests
          News
          Analysis
          24/7
          Columns
          Education
          Company
          Careers
          About Us
          Contact Us
          Advertising
          Help Center
          Feedback
          User Agreement
          Privacy Policy
          Business

          White Label

          Data API

          Web Plug-ins

          Poster Maker

          Affiliate Program

          Risk Disclosure

          The risk of loss in trading financial instruments such as stocks, FX, commodities, futures, bonds, ETFs and crypto can be substantial. You may sustain a total loss of the funds that you deposit with your broker. Therefore, you should carefully consider whether such trading is suitable for you in light of your circumstances and financial resources.

          No decision to invest should be made without thoroughly conducting due diligence by yourself or consulting with your financial advisors. Our web content might not suit you since we don't know your financial conditions and investment needs. Our financial information might have latency or contain inaccuracy, so you should be fully responsible for any of your trading and investment decisions. The company will not be responsible for your capital loss.

          Without getting permission from the website, you are not allowed to copy the website's graphics, texts, or trademarks. Intellectual property rights in the content or data incorporated into this website belong to its providers and exchange merchants.

          Not Logged In

          Log in to access more features

          FastBull Membership

          Not yet

          Purchase

          Become a signal provider
          Help Center
          Customer Service
          Dark Mode
          Price Up/Down Colors

          Log In

          Sign Up

          Position
          Layout
          Fullscreen
          Default to Chart
          The chart page opens by default when you visit fastbull.com