Markets
News
Analysis
User
24/7
Economic Calendar
Education
Data
- Names
- Latest
- Prev


Signal Accounts for Members
All Signal Accounts
All Contests


Japan Tankan Small Manufacturing Outlook Index (Q4)A:--
F: --
P: --
Japan Tankan Large Non-Manufacturing Outlook Index (Q4)A:--
F: --
P: --
Japan Tankan Large Manufacturing Outlook Index (Q4)A:--
F: --
P: --
Japan Tankan Small Manufacturing Diffusion Index (Q4)A:--
F: --
P: --
Japan Tankan Large-Enterprise Capital Expenditure YoY (Q4)A:--
F: --
P: --
U.K. Rightmove House Price Index YoY (Dec)A:--
F: --
P: --
China, Mainland Industrial Output YoY (YTD) (Nov)A:--
F: --
P: --
China, Mainland Urban Area Unemployment Rate (Nov)A:--
F: --
P: --
Saudi Arabia CPI YoY (Nov)A:--
F: --
P: --
Euro Zone Industrial Output YoY (Oct)A:--
F: --
P: --
Euro Zone Industrial Output MoM (Oct)A:--
F: --
P: --
Canada Existing Home Sales MoM (Nov)A:--
F: --
P: --
Canada National Economic Confidence IndexA:--
F: --
P: --
Canada New Housing Starts (Nov)A:--
F: --
U.S. NY Fed Manufacturing Employment Index (Dec)A:--
F: --
P: --
U.S. NY Fed Manufacturing Index (Dec)A:--
F: --
P: --
Canada Core CPI YoY (Nov)A:--
F: --
P: --
Canada Manufacturing Unfilled Orders MoM (Oct)A:--
F: --
P: --
U.S. NY Fed Manufacturing Prices Received Index (Dec)A:--
F: --
P: --
U.S. NY Fed Manufacturing New Orders Index (Dec)A:--
F: --
P: --
Canada Manufacturing New Orders MoM (Oct)A:--
F: --
P: --
Canada Core CPI MoM (Nov)A:--
F: --
P: --
Canada Trimmed CPI YoY (SA) (Nov)A:--
F: --
P: --
Canada Manufacturing Inventory MoM (Oct)A:--
F: --
P: --
Canada CPI YoY (Nov)A:--
F: --
P: --
Canada CPI MoM (Nov)A:--
F: --
P: --
Canada CPI YoY (SA) (Nov)A:--
F: --
P: --
Canada Core CPI MoM (SA) (Nov)A:--
F: --
P: --
Canada CPI MoM (SA) (Nov)A:--
F: --
P: --
Federal Reserve Board Governor Milan delivered a speech
U.S. NAHB Housing Market Index (Dec)A:--
F: --
P: --
Australia Composite PMI Prelim (Dec)--
F: --
P: --
Australia Services PMI Prelim (Dec)--
F: --
P: --
Australia Manufacturing PMI Prelim (Dec)--
F: --
P: --
Japan Manufacturing PMI Prelim (SA) (Dec)--
F: --
P: --
U.K. 3-Month ILO Employment Change (Oct)--
F: --
P: --
U.K. Unemployment Claimant Count (Nov)--
F: --
P: --
U.K. Unemployment Rate (Nov)--
F: --
P: --
U.K. 3-Month ILO Unemployment Rate (Oct)--
F: --
P: --
U.K. Average Weekly Earnings (3-Month Average, Including Bonuses) YoY (Oct)--
F: --
P: --
U.K. Average Weekly Earnings (3-Month Average, Excluding Bonuses) YoY (Oct)--
F: --
P: --
France Services PMI Prelim (Dec)--
F: --
P: --
France Composite PMI Prelim (SA) (Dec)--
F: --
P: --
France Manufacturing PMI Prelim (Dec)--
F: --
P: --
Germany Services PMI Prelim (SA) (Dec)--
F: --
P: --
Germany Manufacturing PMI Prelim (SA) (Dec)--
F: --
P: --
Germany Composite PMI Prelim (SA) (Dec)--
F: --
P: --
Euro Zone Composite PMI Prelim (SA) (Dec)--
F: --
P: --
Euro Zone Services PMI Prelim (SA) (Dec)--
F: --
P: --
Euro Zone Manufacturing PMI Prelim (SA) (Dec)--
F: --
P: --
U.K. Services PMI Prelim (Dec)--
F: --
P: --
U.K. Manufacturing PMI Prelim (Dec)--
F: --
P: --
U.K. Composite PMI Prelim (Dec)--
F: --
P: --
Euro Zone ZEW Economic Sentiment Index (Dec)--
F: --
P: --
Germany ZEW Current Conditions Index (Dec)--
F: --
P: --
Germany ZEW Economic Sentiment Index (Dec)--
F: --
P: --
Euro Zone Trade Balance (Not SA) (Oct)--
F: --
P: --
Euro Zone ZEW Current Conditions Index (Dec)--
F: --
P: --
Euro Zone Trade Balance (SA) (Oct)--
F: --
P: --
Euro Zone Total Reserve Assets (Nov)--
F: --
P: --
U.K. Inflation Rate Expectations--
F: --
P: --


No matching data
Latest Views
Latest Views
Trending Topics
Top Columnists
Latest Update
White Label
Data API
Web Plug-ins
Affiliate Program
View All

No data
China on Friday struck back at President Trump's ballooning tariffs, raising its duties on imports of US goods to 125% from 84%.

Above: GBP/EUR at 15-minute intervals alongside US Dollar Index. Click for closer inspection.
Above: GBP/EUR at weekly intervals with Fibonacci retracements of recovery from 2022 lows highlighting possible areas of support for Sterling, with US Dollar Index. Click for closer inspection.The dollar extended losses after its biggest plunge in three years as China raised tariffs on all US goods, the latest salvo in the trade war that’s whipsawed markets this week.
US stock futures and Europe’s Stoxx 600 equity benchmark turned lower. Havens such as the yen, Swiss franc and gold gained while the euro rose to its strongest in three years. The 10-year Treasury yield held above 4.4% after rising 50 basis points this week.
China’s latest move came after President Donald Trump hiked US levies on the Asian nation even as he paused additional duties on some other trading partners. The greenback has become the latest victim of market turmoil as the trade war risks pushing the US into a recession, amid a broader exodus from US assets that’s raised questions about the haven status of Treasuries.
“The main player of global trade just tore down the play-book and we don’t know what his endgame is,” said Olivier Baduel, head of European equities at OFI Invest AM in Paris. “We’re witnessing a loss of visibility and we are still in a phase of uncertainty.”
Investors will look for guidance later Friday from executives at some of the biggest US banks which are due to report first-quarter earnings, including Wells Fargo & Co., JPMorgan Chase & Co. and Morgan Stanley. BlackRock Inc. is also reporting before the US open.
The $7.5 trillion-a-day currency market has been on edge since Trump’s return to the White House and his on-again, off-again announcements on tariffs. The dollar gauge has lost more than 6% since its February peak and was down about 0.9% on Friday, on track for its biggest weekly decline since November 2022.
An index of Asia-Pacific stocks was set for a third week of declines as market relief turned to angst after the White House clarified US tariffs on China rose to 145%. Shares in China and Hong Kong, however, rose on Friday on expectations the government will come out with more economic stimulus.
The worsening tariffs spat is already affecting corporations. Audi has suspended deliveries to the US and the bigger-than-expected import tax has also prompted Japan’s Nintendo Co. to delay pre-orders for its long-awaited Switch 2 gaming console. From Ray-Bans to wigs, US buyers may see unexpected price rises.
Bitcoin could keep sliding as cooler-than-expected U.S. inflation data has sparked fears that President Trump might go harder on tariffs, a move that could actually bring inflation back up in the long run.
On Friday, Bitcoin (BTC) dropped below $80,000 and was still down about 1.6% over the last 24 hours at press time. This came even as the U.S. Consumer Price Index (CPI) for March showed inflation falling to 2.4%, down from 2.8% in February and slightly better than the 2.5% forecasted by analysts.
The CPI, released monthly by the U.S. Bureau of Labor Statistics, is a key inflation gauge and influences the Federal Reserve’s monetary policy decisions. Normally, lower inflation reduces the need for rate hikes, which tends to benefit risk assets like crypto and stocks.
However, despite the positive CPI reading, markets didn’t rally. The S&P 500 and Nasdaq both opened sharply lower and closed the day down 3.4% and 4.3%, respectively.
The total crypto market cap has also dropped 2.8% in the past 24 hours, suggesting that broader concerns are overshadowing any relief from cooling inflation.
Trump’s trade policies remain the key concern. On April 9, President Trump announced a 90-day pause on planned tariff hikes and introduced a 10% reciprocal tariff on most countries — but notably excluded China, where it raised tariffs on Chinese imports to a steep 125%, accusing Beijing of failing to respect global trade norms.
The move briefly calmed markets, sending Bitcoin up over 7% to $82,000 as investors welcomed the temporary easing of trade tensions.
However, that optimism quickly faded after China responded with 84% tariffs on U.S. goods starting April 10. This retaliation renewed fears of a prolonged U.S.-China trade war, which could weigh heavily on investor confidence, especially after the 90-day window ends.
According to pundits at The Kobeissi Letter, the combination of a strong jobs report and cooling inflation may actually give Trump more political room to escalate tariffs further, potentially undoing the progress made on inflation.
At the same time, the likelihood of the Federal Reserve cutting interest rates in the near term appears slim. CME Group’s FedWatch Tool points to an 81.5% chance the Fed will hold rates steady at its May 7 meeting. With no rate cuts expected until at least June, the macro backdrop remains uncertain for Bitcoin.
Capital inflows into Bitcoin have also significantly slowed this year. Analytics platform Glassnode recently flagged that inflows have plunged over 90% from a peak of $100 billion to just around $6 billion. Typically, this is a sign that investor interest may be cooling due to the current uncertainty.
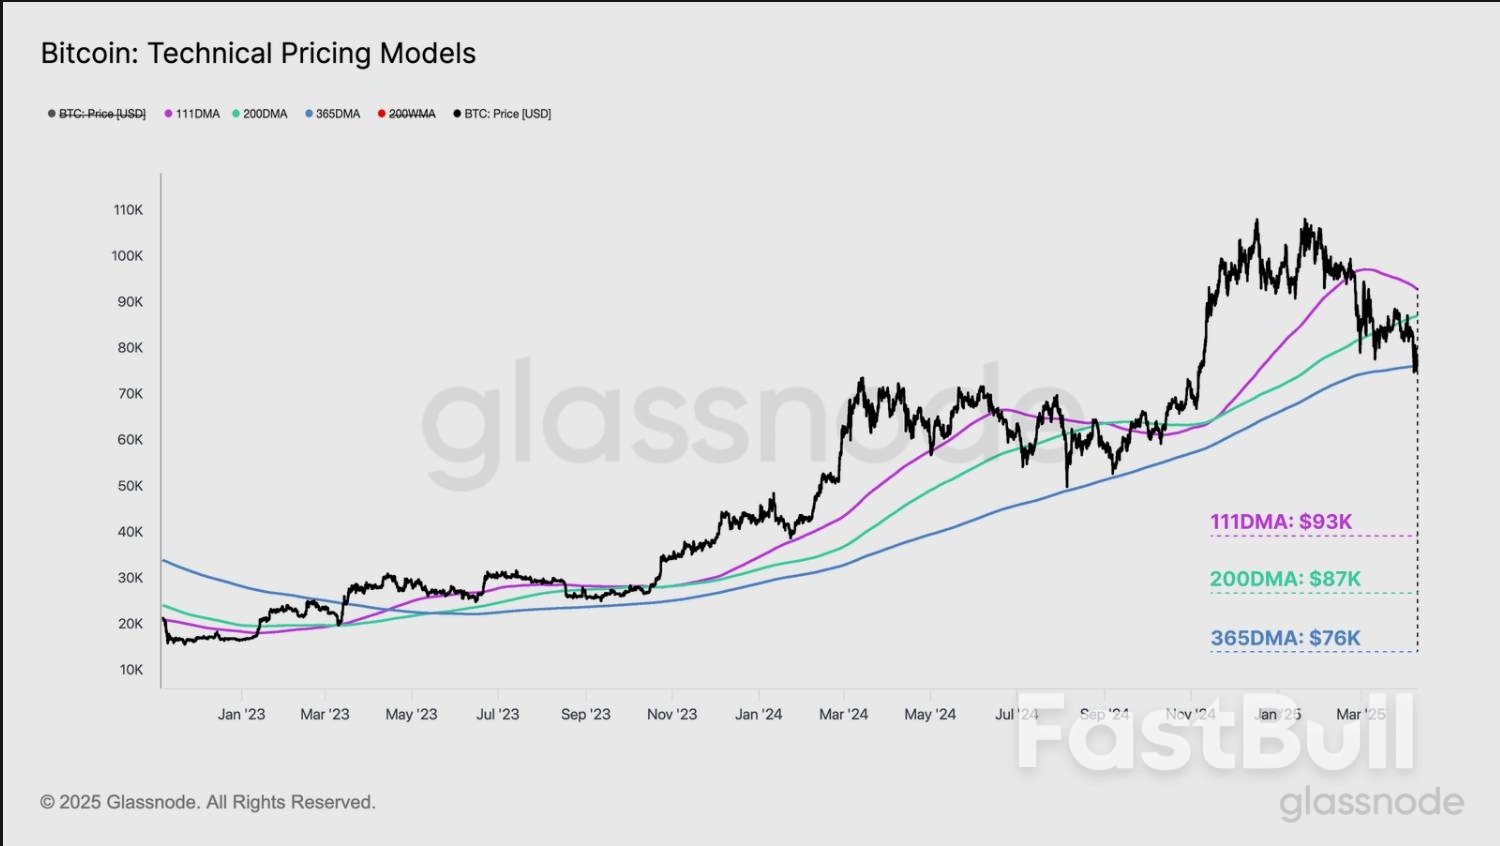
Key Bitcoin Support and Resistance Levels | Source: GlassnodeTechnical indicators also point to a potential downside. If Bitcoin fails to hold the $80,000 level, Glassnode analysts warn it could revisit lower support zones, possibly the 356-day exponential moving average at $76k.
The next key levels to watch below this price point are the active realized price at $71,000, and if things worsen, the true market mean near $65,000. These are major support zones where long-term holders usually step in. But if BTC loses this range, it could mean more downside ahead.
Still, not everyone views Bitcoin’s recent pullback as a sign of weakness. Some analysts argue that Bitcoin is, in fact, holding up remarkably well in comparison to traditional markets.
While Bitcoin’s seven-day realized volatility has doubled to 83%, it still remains significantly lower than the S&P 500’s, a development that hints at the asset’s potential evolution into a low-beta hedge against traditional equities. On a 30-day basis, Bitcoin appears notably less volatile than the S&P 500.
Adding to that, some on-chain data suggests that bigger players are buying the dip.
According to Santiment, 132 new “shark” wallets, those holding more than 10 BTC, have popped up in the last 24 hours.
Data from CryptoQuant also shows that around 48,575 BTC, worth roughly $3.6 billion, has moved into accumulation wallets. It’s the biggest whale activity seen since 2022, which could mean that major holders are positioning themselves for a longer-term play, even as short-term uncertainty lingers.
That said, while many are still on edge, others are starting to see signs of a potential recovery on the charts.
According to Merlijn The Trader, Bitcoin just finished a double bottom pattern, which is a classic sign of a trend reversal. Now that it’s trading above $81k and has already bounced off the $79,900 level, a potential breakout could be on the horizon with upside targets around $86K..
If BTC manages to post a weekly close above $86k, some analysts believe it could pave the way for bulls to target $94k.
However, unless some form of resolution is reached between the U.S. and China, this tug-of-war over tariffs will likely keep dragging on markets.
White Label
Data API
Web Plug-ins
Poster Maker
Affiliate Program
The risk of loss in trading financial instruments such as stocks, FX, commodities, futures, bonds, ETFs and crypto can be substantial. You may sustain a total loss of the funds that you deposit with your broker. Therefore, you should carefully consider whether such trading is suitable for you in light of your circumstances and financial resources.
No decision to invest should be made without thoroughly conducting due diligence by yourself or consulting with your financial advisors. Our web content might not suit you since we don't know your financial conditions and investment needs. Our financial information might have latency or contain inaccuracy, so you should be fully responsible for any of your trading and investment decisions. The company will not be responsible for your capital loss.
Without getting permission from the website, you are not allowed to copy the website's graphics, texts, or trademarks. Intellectual property rights in the content or data incorporated into this website belong to its providers and exchange merchants.
Not Logged In
Log in to access more features

FastBull Membership
Not yet
Purchase
Log In
Sign Up