

Markets
News
Analysis
User
24/7
Economic Calendar
Education
Data
- Names
- Latest
- Prev


Signal Accounts for Members
All Signal Accounts
All Contests
 Japan Tankan Small Manufacturing Outlook Index (Q4)
A:--
F: --
P: --
Japan Tankan Large Non-Manufacturing Outlook Index (Q4)A:--
F: --
P: --
Japan Tankan Large Manufacturing Outlook Index (Q4)A:--
F: --
P: --
Japan Tankan Small Manufacturing Diffusion Index (Q4)A:--
F: --
P: --
Japan Tankan Large-Enterprise Capital Expenditure YoY (Q4)A:--
F: --
P: --
 U.K. Rightmove House Price Index YoY (Dec)
A:--
F: --
P: --
 China, Mainland Industrial Output YoY (YTD) (Nov)
A:--
F: --
P: --
China, Mainland Urban Area Unemployment Rate (Nov)A:--
F: --
P: --
 Saudi Arabia CPI YoY (Nov)
A:--
F: --
P: --
 Euro Zone Industrial Output YoY (Oct)
A:--
F: --
P: --
Euro Zone Industrial Output MoM (Oct)A:--
F: --
P: --
 Canada Existing Home Sales MoM (Nov)
A:--
F: --
P: --
Canada National Economic Confidence IndexA:--
F: --
P: --
Canada New Housing Starts (Nov)A:--
F: --
 U.S. NY Fed Manufacturing Employment Index (Dec)
A:--
F: --
P: --
U.S. NY Fed Manufacturing Index (Dec)A:--
F: --
P: --
Canada Core CPI YoY (Nov)A:--
F: --
P: --
Canada Manufacturing Unfilled Orders MoM (Oct)A:--
F: --
P: --
U.S. NY Fed Manufacturing Prices Received Index (Dec)A:--
F: --
P: --
U.S. NY Fed Manufacturing New Orders Index (Dec)A:--
F: --
P: --
Canada Manufacturing New Orders MoM (Oct)A:--
F: --
P: --
Canada Core CPI MoM (Nov)A:--
F: --
P: --
Canada Trimmed CPI YoY (SA) (Nov)A:--
F: --
P: --
Canada Manufacturing Inventory MoM (Oct)A:--
F: --
P: --
Canada CPI YoY (Nov)A:--
F: --
P: --
Canada CPI MoM (Nov)A:--
F: --
P: --
Canada CPI YoY (SA) (Nov)A:--
F: --
P: --
Canada Core CPI MoM (SA) (Nov)A:--
F: --
P: --
Canada CPI MoM (SA) (Nov)A:--
F: --
P: --
Federal Reserve Board Governor Milan delivered a speech U.S. NAHB Housing Market Index (Dec)A:--
F: --
P: --
 Australia Composite PMI Prelim (Dec)
--
F: --
P: --
Australia Services PMI Prelim (Dec)--
F: --
P: --
Australia Manufacturing PMI Prelim (Dec)--
F: --
P: --
Japan Manufacturing PMI Prelim (SA) (Dec)--
F: --
P: --
U.K. 3-Month ILO Employment Change (Oct)--
F: --
P: --
U.K. Unemployment Claimant Count (Nov)--
F: --
P: --
U.K. Unemployment Rate (Nov)--
F: --
P: --
U.K. 3-Month ILO Unemployment Rate (Oct)--
F: --
P: --
U.K. Average Weekly Earnings (3-Month Average, Including Bonuses) YoY (Oct)--
F: --
P: --
U.K. Average Weekly Earnings (3-Month Average, Excluding Bonuses) YoY (Oct)--
F: --
P: --
 France Services PMI Prelim (Dec)
--
F: --
P: --
France Composite PMI Prelim (SA) (Dec)--
F: --
P: --
France Manufacturing PMI Prelim (Dec)--
F: --
P: --
 Germany Services PMI Prelim (SA) (Dec)
--
F: --
P: --
Germany Manufacturing PMI Prelim (SA) (Dec)--
F: --
P: --
Germany Composite PMI Prelim (SA) (Dec)--
F: --
P: --
Euro Zone Composite PMI Prelim (SA) (Dec)--
F: --
P: --
Euro Zone Services PMI Prelim (SA) (Dec)--
F: --
P: --
Euro Zone Manufacturing PMI Prelim (SA) (Dec)--
F: --
P: --
U.K. Services PMI Prelim (Dec)--
F: --
P: --
U.K. Manufacturing PMI Prelim (Dec)--
F: --
P: --
U.K. Composite PMI Prelim (Dec)--
F: --
P: --
Euro Zone ZEW Economic Sentiment Index (Dec)--
F: --
P: --
Germany ZEW Current Conditions Index (Dec)--
F: --
P: --
Germany ZEW Economic Sentiment Index (Dec)--
F: --
P: --
Euro Zone Trade Balance (Not SA) (Oct)--
F: --
P: --
Euro Zone ZEW Current Conditions Index (Dec)--
F: --
P: --
Euro Zone Trade Balance (SA) (Oct)--
F: --
P: --
Euro Zone Total Reserve Assets (Nov)--
F: --
P: --
U.K. Inflation Rate Expectations--
F: --
P: --

No matching data
Latest Views
Latest Views
Trending Topics
Top Columnists
Latest Update
White Label
Data API
Web Plug-ins
Affiliate Program
View All
No data
The Pound Sterling (GBP) rose 0.37% to 1.2669 after rebounding from a two-day low of 1.2605, as the US Dollar weakened due to falling US Treasury yields.
The Pound Sterling (GBP) rose 0.37% to 1.2669 after rebounding from a two-day low of 1.2605, as the US Dollar weakened due to falling US Treasury yields. Market sentiment turned negative following US President Trump’s renewed tariff threats on Canadian and Mexican goods. Weak US economic data also weighed on the Dollar, with the 10-year Treasury yield dropping 10 basis points to 4.30%. US home prices rose 4.5% year-over-year in December, slightly higher than November’s 4.3%. The Confederation of British Industry in the UK reported that retailers plan to cut investments due to weak spending and high prices. A Reuters poll suggests the Bank of England (BoE) will likely keep rates steady at 4.50% in March, possibly cutting to 4.25% in Q2. Traders now await comments from BoE’s chief economist, Huw Pill.
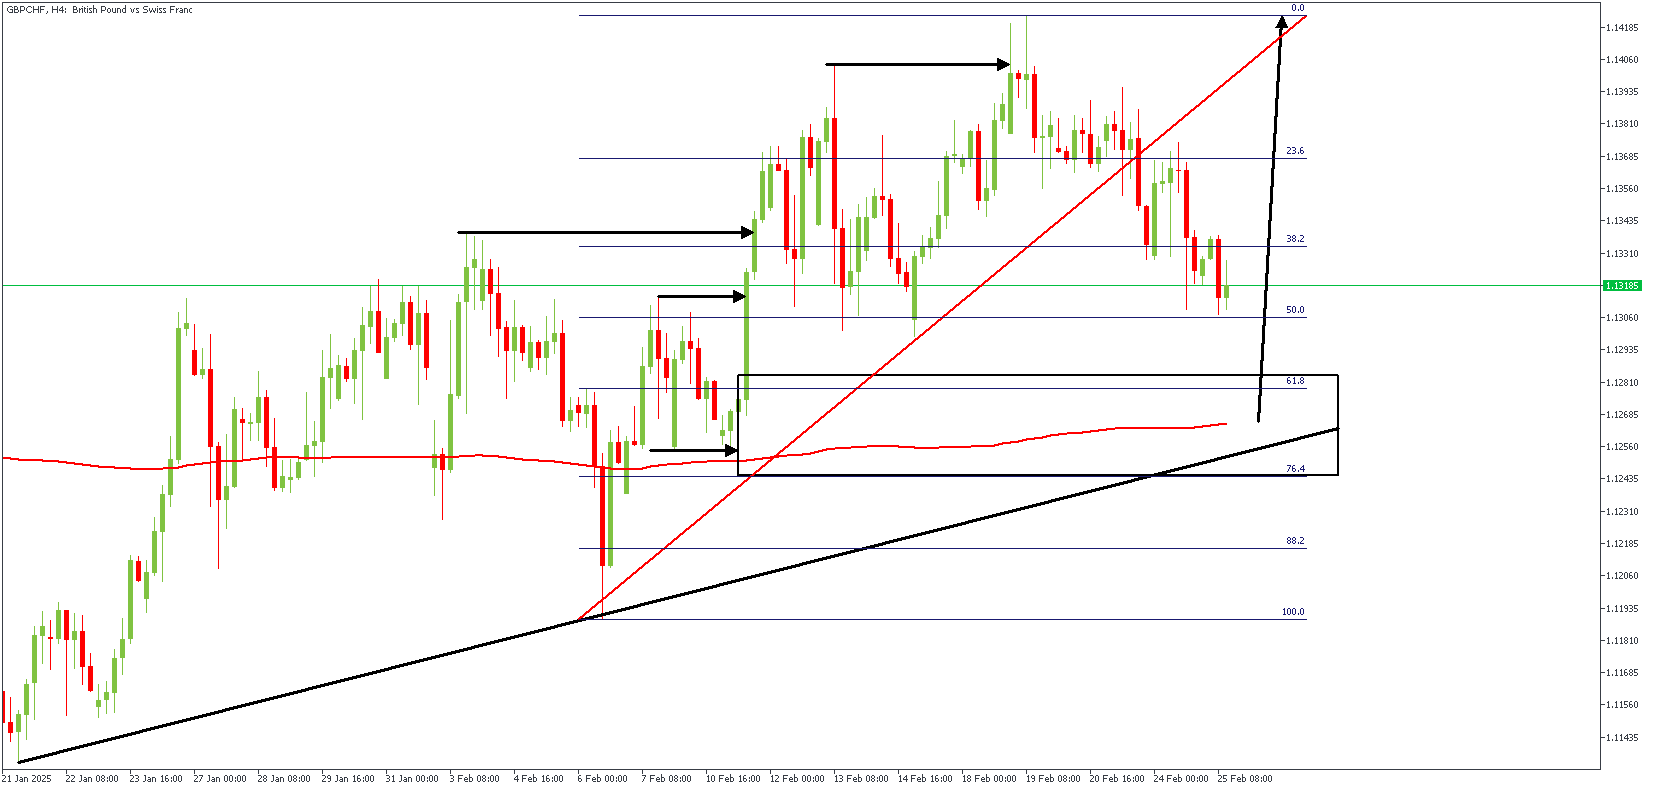
GBP/CHF – H4 Timeframe
The highlighted demand zone on GBP/CHF’s 4-hour timeframe chart is the result of a bullish SBR pattern, with confluences from the 61% Fibonacci retracement level, 200-period moving average support, and trendline support. An FVG near the demand area lends further credence to the bullish sentiment.
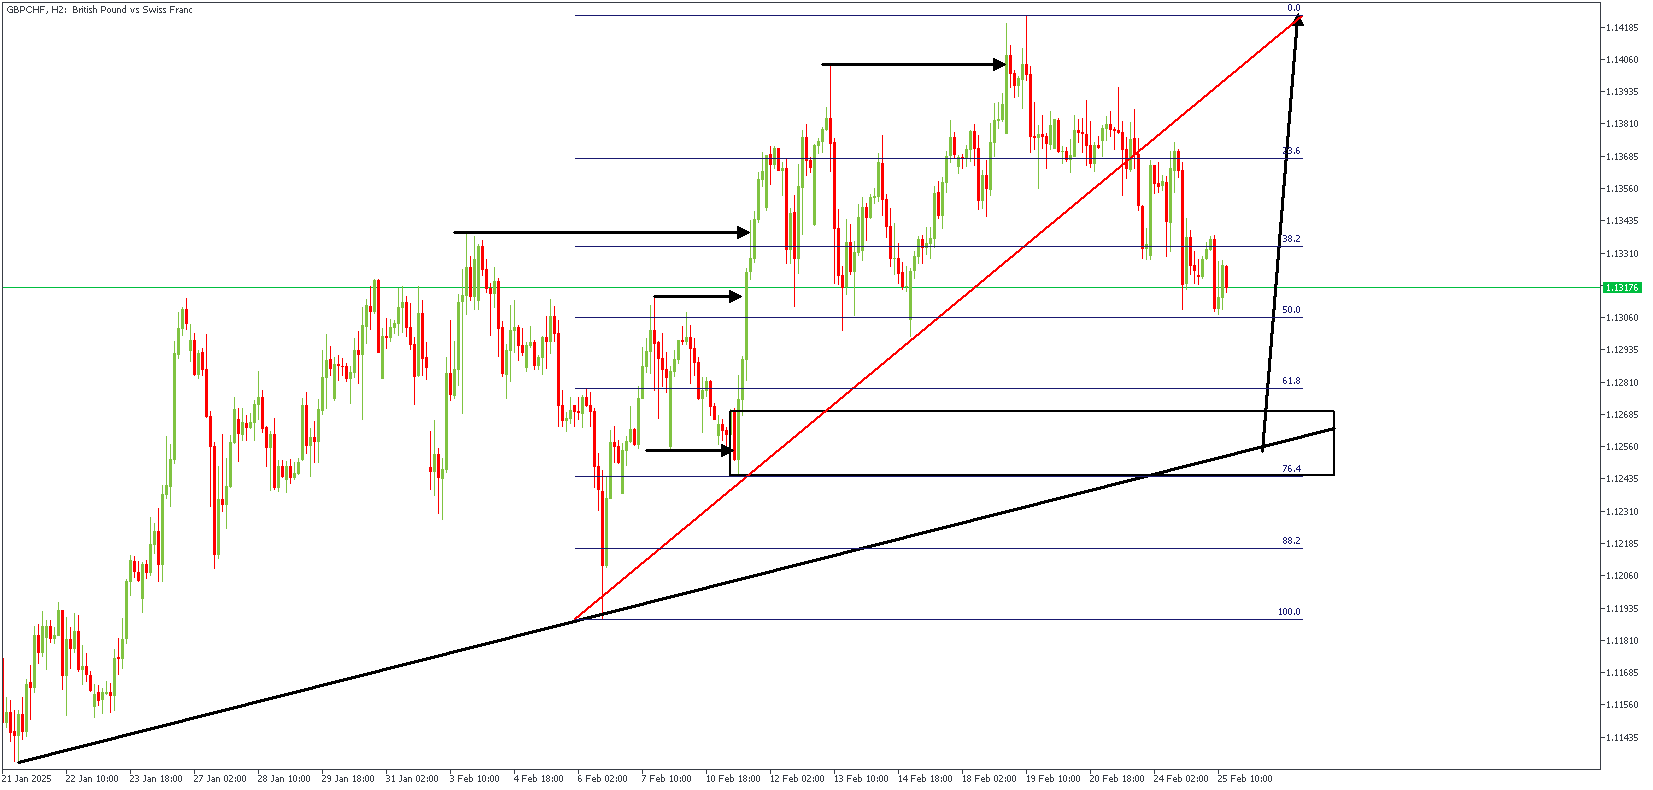
GBPCHF – H3 Timeframe
The 3-hour timeframe chart of GBP/CHF shows the SBR pattern in more detail, with the induced low visibly retracing before filling up the FVG area. The reaction from the confluence of the demand zone, the trendline support, and the 61% Fibonacci retracement level is expected to push prices to create a new higher high.
Analyst’s Expectations:
Direction: Bullish
Target- 1.14218
Invalidation- 1.12162
The New Zealand Dollar (NZD) is facing slight downward pressure against the US Dollar (USD) and could dip further, though it’s unlikely to fall clearly below 0.5715. If it does break that support, reaching 0.5790 is doubtful. In the short term, analysts expected the NZD to move between 0.5735 and 0.5770, which it did—hitting both levels before closing at 0.5733, down 0.17%. The downward momentum has slightly increased, suggesting the NZD might edge lower today. However, any drop is expected to stay above 0.5715. This mild pressure will likely hold if the NZD remains below 0.5760, with minor resistance at 0.5745.
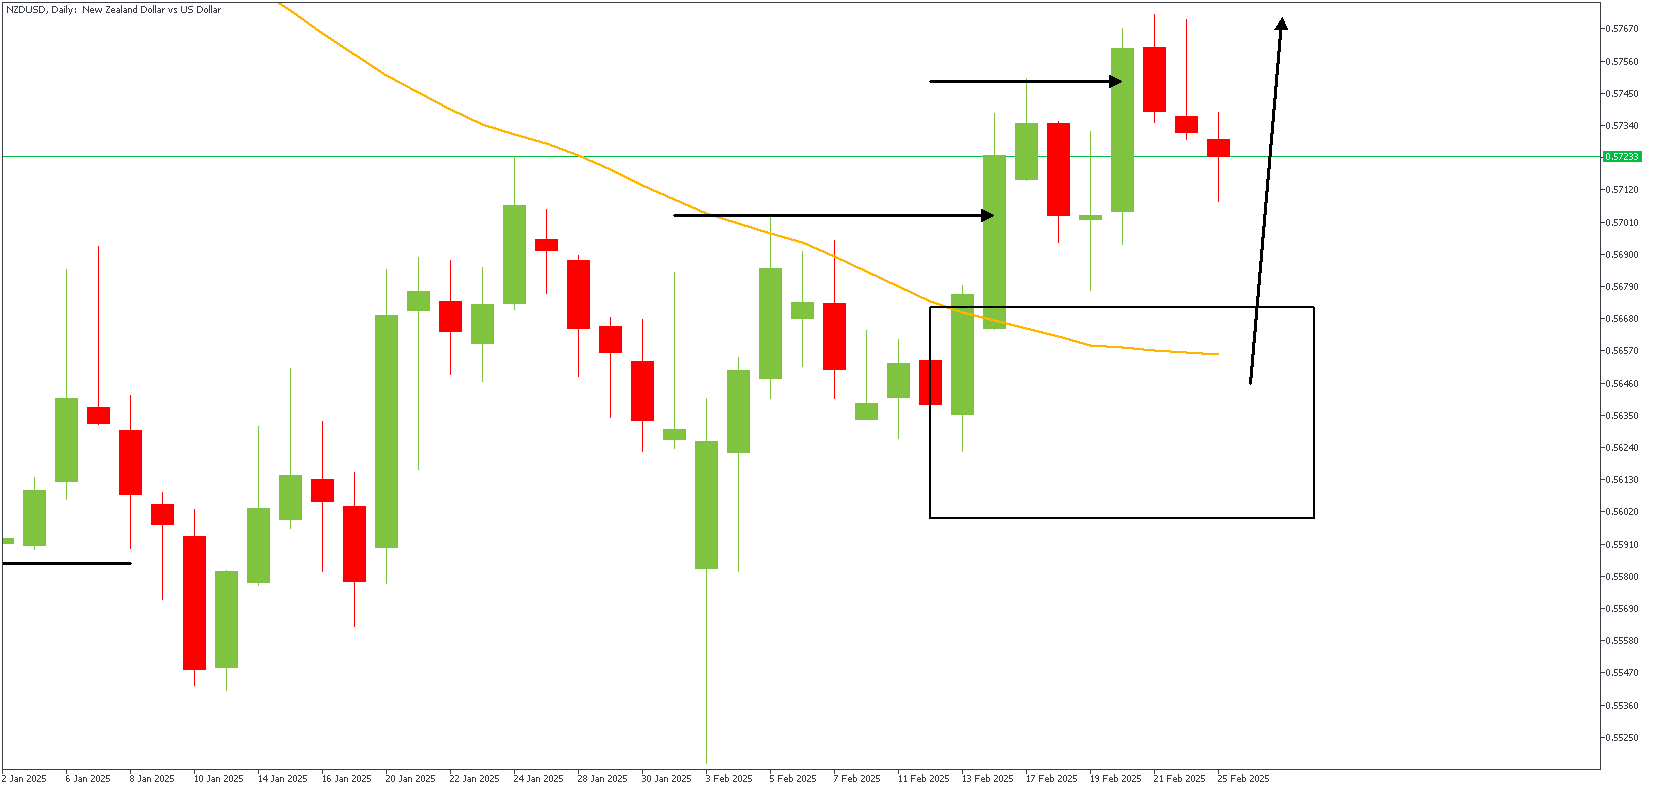
NZDUSD – D1 Timeframe
After breaking above the 50-day moving average, the price action on the daily timeframe chart of NZDUSD proceeded to overshoot the previous high, creating a new higher high in the process. The momentum from the breakout has waned, giving rise to the ongoing retracement move. The expectation is that the confluence region of the drop-base-rally demand zone and the 50-day moving average would provide adequate support for a bullish continuation.
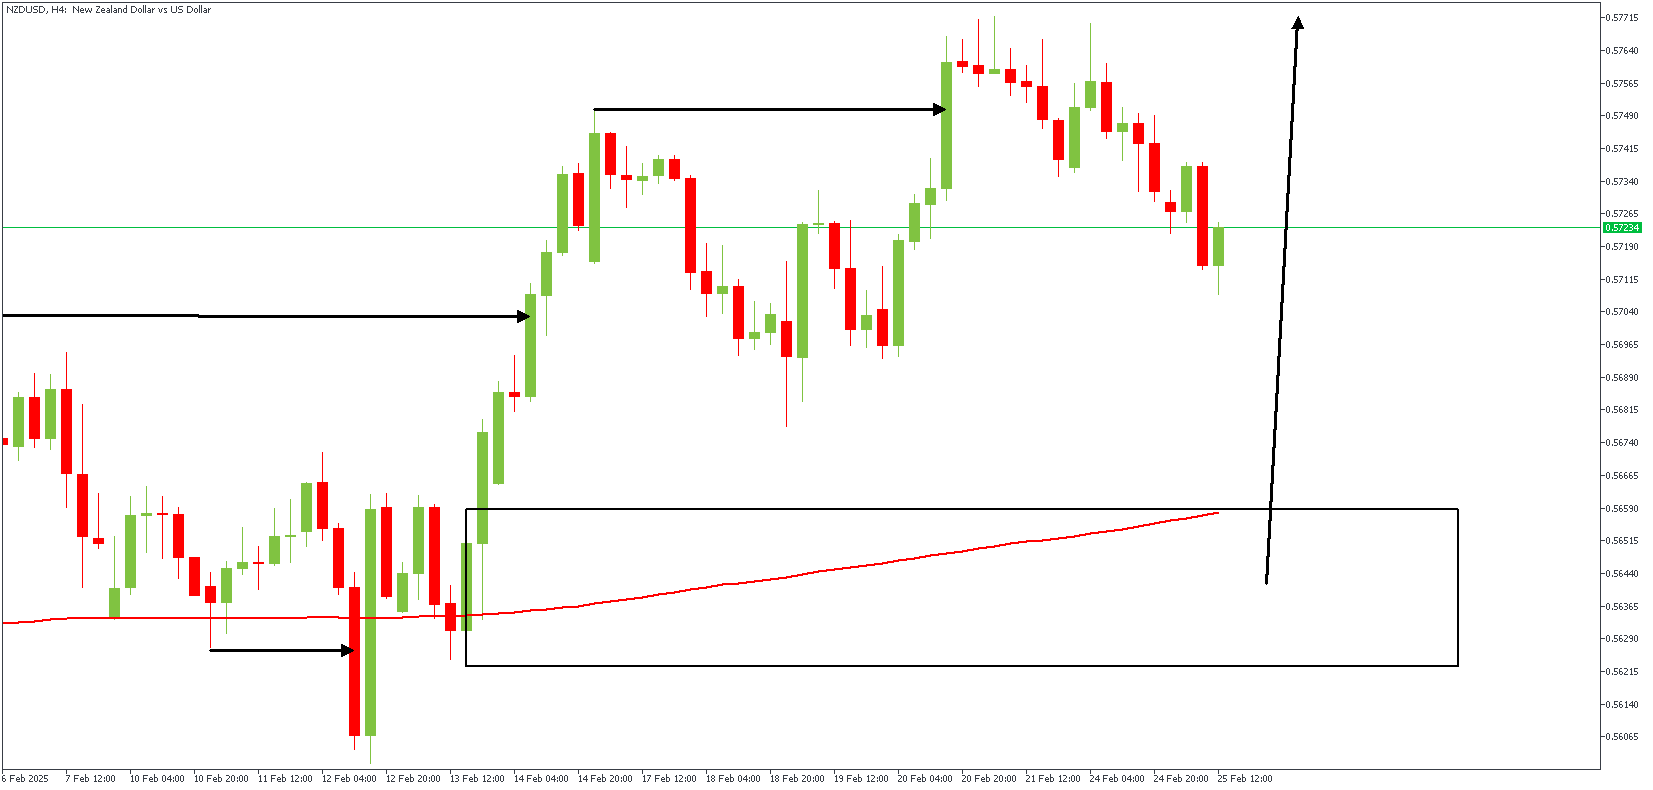
NZDUSD – H4 Timeframe
The 4-hour timeframe chart of NZDUSD shows that the daily timeframe demand zone doubles as the trough of a bullish SBR pattern, with the presence of an FVG, 100-period moving average support, 76% Fibonacci retracement level support, and liquidity at the previously induced low. The expected outcome in this scenario is bullish, with an initial target at the BSL (Buy-Side Liquidity) at the recent high.
Analyst’s Expectations:
Direction: Bullish
Target- 0.57713
Invalidation- 0.56004
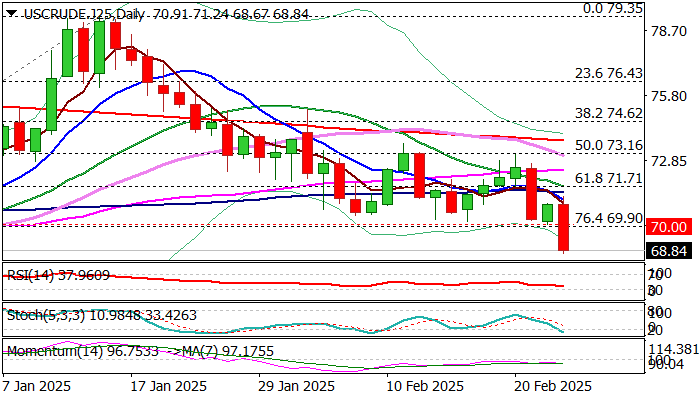
WTI oil price fell below psychological $70 support on Tuesday and hit the lowest levels in two months.
Oil was down nearly 3% on renewed fears about the global economy and lower demand after the latest economic data showed that German economy contracted for the second straight quarter and US consumer confidence declined at the fastest pace since mid-2021.
Strong concerns among investors were also fueled by US tariffs on imports, as President Trump signaled that initially delayed tariffs on imports from Canada and Mexico, will be implemented according to the schedule – at the beginning of next month.
Tariffs on China’s goods imports further contribute to negative outlook, as this would directly fuel inflation, while consequences of trade war would be significant.
Negative fundamentals continue to sour the sentiment and raise pressure on oil prices.
Sustained break below $70/$69.90 supports (psychological / Fibo 76.4% of $66.98/$79.35 rally) to further firm bearish stance and risk dip towards weekly base at $67.00/66.30 zone (Oct/Dec 2024).
Broken $70 zone reverted to solid resistance which should ideally cap.
Res: 69.79; 70.00; 70.83; 71.44
Sup: 68.44; 67.70; 66.98; 66.54
728 RM B 7/F GEE LOK IND BLDG NO 34 HUNG TO RD KWUN TONG KLN HONG KONG


White Label
Data API
Web Plug-ins
Poster Maker
Affiliate Program
The risk of loss in trading financial instruments such as stocks, FX, commodities, futures, bonds, ETFs and crypto can be substantial. You may sustain a total loss of the funds that you deposit with your broker. Therefore, you should carefully consider whether such trading is suitable for you in light of your circumstances and financial resources.
No decision to invest should be made without thoroughly conducting due diligence by yourself or consulting with your financial advisors. Our web content might not suit you since we don't know your financial conditions and investment needs. Our financial information might have latency or contain inaccuracy, so you should be fully responsible for any of your trading and investment decisions. The company will not be responsible for your capital loss.
Without getting permission from the website, you are not allowed to copy the website's graphics, texts, or trademarks. Intellectual property rights in the content or data incorporated into this website belong to its providers and exchange merchants.
Not Logged In
Log in to access more features

FastBull Membership
Not yet
Purchase


Log In
Sign Up


