• Trade
  • Markets
  • Copy
  • Contests
  • News
  • 24/7
  • Calendar
  • Q&A
  • Chats
Trending
Screeners
SYMBOL
LAST
BID
ASK
HIGH
LOW
NET CHG.
%CHG.
SPREAD
SPX
S&P 500 Index
6817.58
6817.58
6817.58
6861.30
6801.50
-9.83
-0.14%
--
DJI
Dow Jones Industrial Average
48370.69
48370.69
48370.69
48679.14
48285.67
-87.35
-0.18%
--
IXIC
NASDAQ Composite Index
23107.22
23107.22
23107.22
23345.56
23012.00
-87.94
-0.38%
--
USDX
US Dollar Index
97.950
98.030
97.950
98.070
97.740
0.000
0.00%
--
EURUSD
Euro / US Dollar
1.17466
1.17474
1.17466
1.17686
1.17262
+0.00072
+ 0.06%
--
GBPUSD
Pound Sterling / US Dollar
1.33725
1.33734
1.33725
1.34014
1.33546
+0.00018
+ 0.01%
--
XAUUSD
Gold / US Dollar
4302.52
4302.93
4302.52
4350.16
4285.08
+3.13
+ 0.07%
--
WTI
Light Sweet Crude Oil
56.321
56.351
56.321
57.601
56.233
-0.912
-1.59%
--

Community Accounts

Signal Accounts
--
Profit Accounts
--
Loss Accounts
--
View More

Become a signal provider

Sell trading signals to earn additional income

View More

Guide to Copy Trading

Get started with ease and confidence

View More

Signal Accounts for Members

All Signal Accounts

Best Return
  • Best Return
  • Best P/L
  • Best MDD
Past 1W
  • Past 1W
  • Past 1M
  • Past 1Y

All Contests

  • All
  • Trump Updates
  • Recommend
  • Stocks
  • Cryptocurrencies
  • Central Banks
  • Featured News
Top News Only
Share

Goldman Sachs Says They Believe That The Copper Price Is Vulnerable To An Ai-Linked Price Correction

Share

Goldman Sachs Upgrades 2026 Copper Price Forecast To $11400 From $10,650

Share

Attempts By Ukrainian Troops To Advance From The South-West To Outskirts Of Kupiansk Are Being Thwarted

Share

Russian Troops Control All Of Kupiansk - IFX Cites Russian Military

Share

On Monday (December 15), The South Korean Won Ultimately Rose 0.60% Against The US Dollar, Closing At 1468.91 Won. The Won Was On An Upward Trend Throughout The Day, Rising Significantly At 17:00 Beijing Time And Reaching A Daily High Of 1463.04 Won At 17:36

Share

Health Ministry: Israeli Forces Kill Palestinian Teen In West Bank

Share

New York Federal Reserve President Williams: Over Time, The Size Of Reserves Could Grow From $2.9 Trillion

Share

New York Fed President Williams: AI Valuations Are High, But There Is A Real Driving Factor

Share

New York Federal Reserve President Williams: The Job Market Is In Very Good Shape

Share

New York Fed President Williams: 'Very Supportive' Of USA Central Bank's Decision To Cut Interest Rates Last Week

Share

New York Fed President Williams: 'Too Early To Say' What Central Bank Should Do At January Meeting

Share

New York Fed President Williams: Strong Markets Part Of Reason Why Economy Will Grow Robustly In 2026

Share

New York Fed President Williams: What Constitutes Ample Reserves Will Change Over Time

Share

New York Fed President Williams: Market Valuations 'Elevated,' But There Are Reasons For Pricing

Share

New York Fed President Williams: Ample Reserves System Working Very Well

Share

New York Fed President Williams: Some Signs That Parts Of Underlying Economy Not As Strong As GDP Data Suggests

Share

New York Fed President Williams: Expects Coming Job Data Will Show Gradual Cooling

Share

Ukraine President Zelenskiy: Monitoring Of Ceasefire Should Be Part Of Security Guarantees

Share

Ukraine President Zelenskiy: Ukraine Needs Clear Understanding On Security Guarantees Before Taking Any Decisions Regarding Frontlines

Share

U.S. Commerce Secretary Rutnick Praised Korea Zinc Co. Ltd., Stating That The United States Will Have Priority Access To The Company's Products In 2026

TIME
ACT
FCST
PREV
Japan Tankan Small Manufacturing Outlook Index (Q4)

A:--

F: --

P: --

Japan Tankan Large Non-Manufacturing Outlook Index (Q4)

A:--

F: --

P: --

Japan Tankan Large Manufacturing Outlook Index (Q4)

A:--

F: --

P: --

Japan Tankan Small Manufacturing Diffusion Index (Q4)

A:--

F: --

P: --

Japan Tankan Large-Enterprise Capital Expenditure YoY (Q4)

A:--

F: --

P: --

U.K. Rightmove House Price Index YoY (Dec)

A:--

F: --

P: --

China, Mainland Industrial Output YoY (YTD) (Nov)

A:--

F: --

P: --

China, Mainland Urban Area Unemployment Rate (Nov)

A:--

F: --

P: --

Saudi Arabia CPI YoY (Nov)

A:--

F: --

P: --

Euro Zone Industrial Output YoY (Oct)

A:--

F: --

P: --

Euro Zone Industrial Output MoM (Oct)

A:--

F: --

P: --

Canada Existing Home Sales MoM (Nov)

A:--

F: --

P: --

Canada National Economic Confidence Index

A:--

F: --

P: --

Canada New Housing Starts (Nov)

A:--

F: --

P: --
U.S. NY Fed Manufacturing Employment Index (Dec)

A:--

F: --

P: --

U.S. NY Fed Manufacturing Index (Dec)

A:--

F: --

P: --

Canada Core CPI YoY (Nov)

A:--

F: --

P: --

Canada Manufacturing Unfilled Orders MoM (Oct)

A:--

F: --

P: --

U.S. NY Fed Manufacturing Prices Received Index (Dec)

A:--

F: --

P: --

U.S. NY Fed Manufacturing New Orders Index (Dec)

A:--

F: --

P: --

Canada Manufacturing New Orders MoM (Oct)

A:--

F: --

P: --

Canada Core CPI MoM (Nov)

A:--

F: --

P: --

Canada Trimmed CPI YoY (SA) (Nov)

A:--

F: --

P: --

Canada Manufacturing Inventory MoM (Oct)

A:--

F: --

P: --

Canada CPI YoY (Nov)

A:--

F: --

P: --

Canada CPI MoM (Nov)

A:--

F: --

P: --

Canada CPI YoY (SA) (Nov)

A:--

F: --

P: --

Canada Core CPI MoM (SA) (Nov)

A:--

F: --

P: --

Canada CPI MoM (SA) (Nov)

A:--

F: --

P: --

Federal Reserve Board Governor Milan delivered a speech
U.S. NAHB Housing Market Index (Dec)

A:--

F: --

P: --

Australia Composite PMI Prelim (Dec)

--

F: --

P: --

Australia Services PMI Prelim (Dec)

--

F: --

P: --

Australia Manufacturing PMI Prelim (Dec)

--

F: --

P: --

Japan Manufacturing PMI Prelim (SA) (Dec)

--

F: --

P: --

U.K. 3-Month ILO Employment Change (Oct)

--

F: --

P: --

U.K. Unemployment Claimant Count (Nov)

--

F: --

P: --

U.K. Unemployment Rate (Nov)

--

F: --

P: --

U.K. 3-Month ILO Unemployment Rate (Oct)

--

F: --

P: --

U.K. Average Weekly Earnings (3-Month Average, Including Bonuses) YoY (Oct)

--

F: --

P: --

U.K. Average Weekly Earnings (3-Month Average, Excluding Bonuses) YoY (Oct)

--

F: --

P: --

France Services PMI Prelim (Dec)

--

F: --

P: --

France Composite PMI Prelim (SA) (Dec)

--

F: --

P: --

France Manufacturing PMI Prelim (Dec)

--

F: --

P: --

Germany Services PMI Prelim (SA) (Dec)

--

F: --

P: --

Germany Manufacturing PMI Prelim (SA) (Dec)

--

F: --

P: --

Germany Composite PMI Prelim (SA) (Dec)

--

F: --

P: --

Euro Zone Composite PMI Prelim (SA) (Dec)

--

F: --

P: --

Euro Zone Services PMI Prelim (SA) (Dec)

--

F: --

P: --

Euro Zone Manufacturing PMI Prelim (SA) (Dec)

--

F: --

P: --

U.K. Services PMI Prelim (Dec)

--

F: --

P: --

U.K. Manufacturing PMI Prelim (Dec)

--

F: --

P: --

U.K. Composite PMI Prelim (Dec)

--

F: --

P: --

Euro Zone ZEW Economic Sentiment Index (Dec)

--

F: --

P: --

Germany ZEW Current Conditions Index (Dec)

--

F: --

P: --

Germany ZEW Economic Sentiment Index (Dec)

--

F: --

P: --

Euro Zone Trade Balance (Not SA) (Oct)

--

F: --

P: --

Euro Zone ZEW Current Conditions Index (Dec)

--

F: --

P: --

Euro Zone Trade Balance (SA) (Oct)

--

F: --

P: --

Euro Zone Total Reserve Assets (Nov)

--

F: --

P: --

U.K. Inflation Rate Expectations

--

F: --

P: --

Q&A with Experts
    • All
    • Chatrooms
    • Groups
    • Friends
    Connecting
    .
    .
    .
    Type here...
    Add Symbol or Code

      No matching data

      All
      Trump Updates
      Recommend
      Stocks
      Cryptocurrencies
      Central Banks
      Featured News
      • All
      • Russia-Ukraine Conflict
      • Middle East Flashpoint
      • All
      • Russia-Ukraine Conflict
      • Middle East Flashpoint
      Search
      Products

      Charts Free Forever

      Chats Q&A with Experts
      Screeners Economic Calendar Data Tools
      Membership Features
      Data Warehouse Market Trends Institutional Data Policy Rates Macro

      Market Trends

      Market Sentiment Order Book Forex Correlations

      Top Indicators

      Charts Free Forever
      Markets

      News

      News Analysis 24/7 Columns Education
      From Institutions From Analysts
      Topics Columnists

      Latest Views

      Latest Views

      Trending Topics

      Top Columnists

      Latest Update

      Signals

      Copy Rankings Latest Signals Become a signal provider AI Rating
      Contests
      Brokers

      Overview Brokers Assessment Rankings Regulators News Claims
      Broker listing Forex Brokers Comparison Tool Live Spread Comparison Scam
      Q&A Complaint Scam Alert Videos Tips to Detect Scam
      More

      Business
      Events
      Careers About Us Advertising Help Center

      White Label

      Data API

      Web Plug-ins

      Affiliate Program

      Awards Institution Evaluation IB Seminar Salon Event Exhibition
      Vietnam Thailand Singapore Dubai
      Fans Party Investment Sharing Session
      FastBull Summit BrokersView Expo
      Recent Searches
        Top Searches
          Markets
          News
          Analysis
          User
          24/7
          Economic Calendar
          Education
          Data
          • Names
          • Latest
          • Prev

          View All

          No data

          Scan to Download

          Faster Charts, Chat Faster!

          Download App
          English
          • English
          • Español
          • العربية
          • Bahasa Indonesia
          • Bahasa Melayu
          • Tiếng Việt
          • ภาษาไทย
          • Français
          • Italiano
          • Türkçe
          • Русский язык
          • 简中
          • 繁中
          Open Account
          Search
          Products
          Charts Free Forever
          Markets
          News
          Signals

          Copy Rankings Latest Signals Become a signal provider AI Rating
          Contests
          Brokers

          Overview Brokers Assessment Rankings Regulators News Claims
          Broker listing Forex Brokers Comparison Tool Live Spread Comparison Scam
          Q&A Complaint Scam Alert Videos Tips to Detect Scam
          More

          Business
          Events
          Careers About Us Advertising Help Center

          White Label

          Data API

          Web Plug-ins

          Affiliate Program

          Awards Institution Evaluation IB Seminar Salon Event Exhibition
          Vietnam Thailand Singapore Dubai
          Fans Party Investment Sharing Session
          FastBull Summit BrokersView Expo

          The RMB facing four major devaluation pressures in 2022

          Summary:

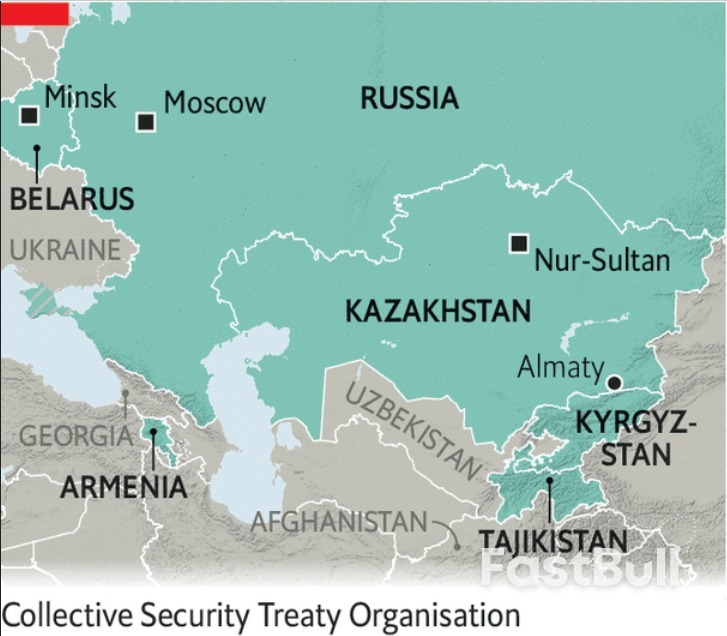
          In 2022, the RMB exchange rate will face depreciation pressure from four aspects: narrowing domestic and foreign currency spreads, changes in economic growth gap, narrowing foreign trade gap, and reversal of risk expectation gap.

          In 2021, the RMB exchange rate fluctuated in both directions, with a slight appreciation of 2.3%. In 2022, the RMB exchange rate is facing four depreciation pressure caused by the "four differential changes". Enterprises, especially import enterprises and foreign debt borrowing enterprises, should establish the concept of risk neutrality, effectively hedge exchange rate risks, and beware of losses caused by exchange rate depreciation. Financial institutions should actively provide enterprises with exchange rate hedging services to reduce the cost of exchange rate hedging for micro, small and medium-sized enterprises.

          The spreads of domestic and foreign currency are narrowing

          The market expects the Fed to raise rates three times in 2022, with current pricing in the Fed funds futures market points to about a 60% likelihood of a hike in March. If the Fed raises rates in March, the number of hikes for the year could rise to four, and the probability of four Fed rate hikes is now about 40%.
          The current pricing in the global financial market and risk appetite has not fully reflected the expectations for Fed’s rate hikes, once the Fed raised interest rates sharply than expected, it will inevitably boost Treasuries yields, narrowing the domestic and foreign spreads, and cross-border capital may flow from emerging markets, including China, pushing emerging market currencies, including the RMB, to depreciate.

          The changes in the economic growth gap

          In World Economic Outlook, October 2021, the IMF projected the U.S. economy will grow 5.2% in 2022, revised upward by 0.3% from July's and by 1.7% from April's projection. In comparison, IMF projected Eurozone and Japan to grow, respectively, 4.3% and 2.2% in 2022. The IMF's upward revision of the U.S. economic growth rate is also greater than the 0 and 0.2% for the Eurozone and Japan.
          Meanwhile, the passage of the infrastructure bill in Congress and tentative progress on the debt ceiling should strengthen the U.S. economy compared to other economies in 2022. As a result, the DXY rose continuously in the fourth quarter and crossed the 96 mark, hitting the highest level since July 2020, driving currencies of other developed economies and emerging markets to depreciate against the USD.

          The foreign trade gap is narrowing

          Recently, the pandemic has globally rebounded under the influence of the Omicron variant, but data from South Africa, the UK, and the U.S. show that people infect with the Omicron are mostly mild, with low hospitalization and mortality rates. Uptake of vaccinations has risen in the U.S. and Israel has begun a fourth booster shot to combat the latest outbreak, and there have been news reports of good clinical trial data for a drug targeting CVOID-19 pneumonia.
          Overall, the global pandemic may gradually ease in 2022, and the production of major manufacturing bases in Asia and other parts of the world, as well as major raw material producing areas in South America and the Middle East, will continue to recover. China's export orders may be diverted, and the export growth rate will return to normal.

          The reversion of risk expectation

          The three major U.S. indexes are expected to rise in 2021, with the Dow, S&P 500, and Nasdaq up 19%, 27%, and 21% annually, and hitting new record highs dozens of times. Some commodity prices rose spectacularly in 2021, with Brent up 50%.
          U.S. real estate prices have also surged, with the median price of new homes topping $400,000 for the first time in history, up about 20% year on year. Once the global financial market fluctuates due to the Fed's rate hikes or valuation correction, investors' expectations will shift, which may increase external uncertainties. Some risks may also spill over to China through capital flows of emerging economies and increase the uncertainty of the RMB exchange rate trend.

          Source: financialnews.com.cn, Enterprises should deal with the risk of RMB devaluation caused by the "four difference changes"

          Risk Warnings and Disclaimers
          You understand and acknowledge that there is a high degree of risk involved in trading. Following any strategies or investment methods may lead to potential losses. The content on the site is provided by our contributors and analysts for information purposes only. You are solely responsible for determining whether any trading assets, securities, strategy, or any other product is suitable for investing based on your own investment objectives and financial situation.
          Comments
          Add to Favorites
          Share

          2022 Q1 global market outlook full report

          2021 was a year of rebound and recovery; 2022 is likely to be a year of moderation for economic growth, inflation and investment returns.
          Developed economies have spare capacity, households are sitting on accumulated savings from the pandemic lockdown, and central banks are planning to remove accommodation only gradually. The global economy is poised for a second year of above-trend growth, although slower than 2021. The three main uncertainties for 2022 in our view are:
          1、The durability of the spike in inflation.
          2、The extent and duration of the property market-driven slowdown in China.
          3、Possible further COVID-19 lockdowns as infection rates increase again or new variants emerge.
          We expect the spike in inflation is mostly transitory, although it could reach uncomfortably high levels in early 2022 before declining as supply-side issues are resolved. Meanwhile, Chinese authorities are likely to implement stimulus measures to soften the property slump, however the response may be too late and too small to prevent a deeper downturn. Regarding COVID-19 risks, the success of vaccines and approval of pills to treat infections have made investors more relaxed. The new omicron COVID-19 variant, however, demonstrates that these risks can quickly return.
          Our cycle, value, and sentiment (CVS) investment decisionmaking process continues to score global equities as expensive. The U.S. is the most expensive developed equity market globally in late 2021 and the UK offers the best value. The cycle is still supportive for equities, and it’s becoming a larger headwind for government bonds. Sentiment for equity markets is mixed with pockets of euphoria, such as singlestock retail investors, offset by caution from surveys of market analysts.
          Our asset-class views for 2022:
          1、Equities should outperform bonds.
          2、Long-term bond yields should rise modestly. Our target is2% for the U.S. 10-year Treasury yield by the end of 2022.
          3、The U.S. dollar will weaken as expectations for 2022 U.S.Federal Reserve (Fed) rate hikes are scaled back.
          4、Non-U.S. developed market equities could finallyoutperform U.S. stocks, given their more cyclical natureand relative valuation advantage over U.S. stocks.
          5、The value equity factor to outperform the growth factor.
          6、Emerging markets (EM) will remain under pressure fromthe China slowdown and central bank tightening acrossother EM economies to contain inflation pressures.

          Inflation outlook: Prices to rise, then decline

          The main surprise of 2021 has been the surge in inflation (apart from in Japan) as economies reopened. Some price pressures were to be expected as uneven reopenings from lockdowns disrupted supply chains and as firms hoarded supplies in a move from just-in-time to just-in-case inventory management. The rise in energy prices and the impact of the semiconductor-chip shortage on motor vehicle prices has played a significant role in pushing up inflation measures.
          These issues are only slowly being resolved and inflation may not peak before the end of Q1 2022. Headline inflation could exceed 7% in the United States, but inflationary pressures should subside over the remainder of 2022 as the improving supply side of the global economy catches up with moderating demand. Our modeling suggests core PCE (personal consumption expenditures) inflation in the U.S. could be near the Fed’s 2% target by year-end.
          The main uncertainty is around wages and labor supply. Workers have been slow to rejoin the labor force due to a combination of generous lockdown payments, inadequate childcare and school closures that have affected working parents, and early retirement among those over 50. Lower migration has also created labor shortfalls (a particular issue for post-Brexit Britain). We expect most of these workers will eventually return, which would help moderate wage growth. Labor-market tightness, if it persists, could keep upward pressure on wages and inflation and push core inflation closer to 3% than 2% by the end of 2022. This will be one of our key watchpoints for next year.

          Central banks outlook: Big doves and little hawks

          One theme of 2022 is likely to be central bank divergence between hawks and doves. The major central banks, apart from the Bank of England, are in the dovish camp. The hawks are mostly the smaller central banks. Norway’s Norges Bank and the Reserve Bank of New Zealand (RBNZ) have already lifted rates, and the Bank of Canada is expected to tighten early next year. The Bank of England seems determined to lift rates in early 2022. This is despite the UK having lower inflation and a weaker economy than the U.S.
          It’s unusual to see such a gap between central banks experiencing relatively similar economic conditions. However, the Fed sets the tone for global monetary policy and it seems firmly dovish. The Fed has said it will lift rates only after the U.S. economy has achieved maximum employment, which we think is an unemployment rate of 4%. It would take extraordinary growth in jobs to achieve this by mid-2022, which is when the market expects rate lift-off. We think full employment is more likely by the end of 2022. This will give the Fed time to assess inflation risks before embarking on a gradual hiking path in 2023.
          One indicator that will give the Fed some comfort is the fiveyear/five-year breakeven inflation expectation, based on the pricing of Treasury inflation-protected securities (TIPS). This is the market’s forecast for average inflation over five years in five years’ time. It tells us investors expect inflation will average around 2.25% in the five years from late-2026 to late-2031. The TIPS yields are based on the Consumer Price Index (CPI), while the Fed targets inflation as measured by the PCE deflator. CPI inflation is generally around 0.25% higher than PCE inflation. A breakeven rate of 2.75% would suggest the market sees PCE inflation above 2.5% in five years’ time. Market inflation expectations are currently comfortably below the Fed’s worry point.

          China economic outlook: Growth uncertain

          While the developed economies are likely to record above-trend growth in 2022, a question mark is how far China’s growth falls below trend. The property market downturn, triggered by the collapse of developers such as Evergrande, is a large drag on economic growth. It’s difficult to gauge the exact size of China’s residential property sector, but somewhere around 20% of GDP seems in the ballpark according to various estimates. The knock-on effects to the rest of the economy from wealth effects and local government finances could be significant.
          In the past, downside growth risks in China have been quickly countered by monetary and fiscal stimulus. China’s leaders, however, are worried about excessive leverage in the property sector and have been concerned that speculation-driven property prices made housing unaffordable for ordinary households. Policy support has so far been modest, with some easing of mortgage-lending rules and allowances for developers to refinance existing debt.
          The International Monetary Fund’s latest forecasts, published in October, predict China’s GDP growth will slow from 8% in 2021 to 5.6% in 2022. These already appear out of date and sub-5% growth next year seems likely. The main unknown is how much economic pain China’s leaders are willing to accept to achieve their goal of rebalancing the economy away from an excessive reliance on debt. A reasonable assumption is that there will be some stimulus in the first half of 2022 which should see China’s growth trajectory improve toward the end of the year.
          The China downturn complicates the investment strategy outlook. On one hand, it will take some steam out of global inflationary pressures, particularly commodity prices. On the other, it adds to the headwinds for emerging markets given China’s role as a trade partner. It could also create difficulties for some developed markets. Europe’s machinery exports, for example, are exposed to the Chinese construction sector, and this will be a drag on growth and profits for these European companies.

          Stock and bond market outlook: Cycle still favors equities over bonds

          The clearest strategy in our view for 2022 is that equities should generate higher returns than government bonds. Equities should be supported by above-trend economic growth, solid growth in profit and central banks that are only slowly removing accommodation. These same factors will put upward pressure on government bond yields, but this should be modest.
          The outlook for other asset classes is more nuanced. Abovetrend growth and higher long-term interest rates favor cyclical and value stocks over technology and growth stocks. The rest of the world is overweight cyclical value stocks relative to the U.S., which has a higher weight to technology stocks. This suggests U.S. stocks should underperform the rest of the world. This theme didn’t pay off in 2021, and the U.S. was the best-performing market. However, it could succeed in 2022 as COVID-19 fears recede and a more normal cyclical recovery takes hold.
          Emerging markets (EM) face challenges from the slowdown in China and inflation pressures that have seen a range of EM central banks tighten policy. The positives are that EM equities are cheap relative to developed markets and Chinese technology stocks have already fallen significantly in response to the regulatory crackdowns. EM equities could do well if there is significant stimulus in China early in the year, the Fed stays on hold and the U.S. dollar weakens. This scenario is possible but otherwise EM asset classes face headwinds heading into 2022.
          The U.S. dollar has strengthened through 2021 on market expectations that Fed rate hikes are becoming more likely. It should weaken as investors realize the Fed is likely to remain dovish as inflation risks decline. Dollar weakness should support the performance of non-U.S. markets, which will help offset some of the headwinds facing emerging markets.

          Risks: inflation, China, lockdowns

          Inflation tops the list of concerns heading into 2022. We still expect it will prove mostly transitory, but this may not be apparent until the middle of the year. China is a significant downside risk for global growth. Policy announcements and credit trends will be important watchpoints over coming months.
          COVID-19 refuses to disappear as a risk. New variants that are resistant to current vaccines are the main threat. We don’t yet know the implications of the omicron variant, but it highlights the uncertainty that exists around COVID-19 scenarios. Markets will be volatile around news of rising COVID-19 cases.
          There is another risk to be considered: a much strongerthan-anticipated surge in demand if COVID-19 fears prove unfounded. Households have plenty of savings, there is pent-up demand, surveys point to strong business investment intentions and real borrowing rates are negative. We have a low probability on this outcome, but it would be doubleedged if it occurred. There could be a blow-out rally in equity markets, but there would also be significant Fed tightening which would threaten an earlier end to the economic cycle.

          Market and economic outlook: Regional snapshots

          United States
          The U.S. economy is poised for a year of moderating but significantly above-trend economic growth in 2022. Robust household income and accumulated pandemic savings leave the consumer in a position of strength heading into the new year. We expect robust business investment in 2022, particularly as a record earnings recovery and backlogs align the ability and need to invest for corporations.
          The biggest incremental drag next year comes from fiscal policy. Even if President Biden’s Build Back Better full infrastructure package is passed, its per-year stimulus impact pales in comparison to the lumpy COVID-19 rescue bills in 2020 and 2021. All in, we expect the U.S. economy to deliver 4% real GDP growth in 2022.
          Inflation remains a focus for investors. Moderating demand, rebalancing demand (from goods to services), and a healing supply side of the economy should allow U.S. inflation rates to throttle down aggressively in the second half of 2022. Elevated wage inflation and exceptionally strong labor demand are the key risks to this forecast. Fixed income markets have latched onto the higher inflation theme and now price a 98% probability of Fed liftoff in 2022. We think the risks are skewed toward a later liftoff and, eventually, a higher equilibrium interest rate than currently priced. If this is correct, the U.S. yield curve has the potential to re-steepen modestly, and the 10-year U.S. Treasury yield can end the year near 2%.
          Eurozone
          The Euro area heads toward 2022 with healthy growth momentum. Business surveys show broad-based gains across countries and sectors, and fiscal policy looks set to provide persistent support to growth as the EU recovery fund disbursements pick up and Germany’s new center-left trafficlight coalition government pursues a more supportive fiscal stance. The European Central Bank remains firmly dovish in its policy outlook. We expect European GDP growth will slow in 2022, but should still be over 4%, significantly above the pre-COVID-19 trend rate of 1.4% per annum.
          The main near-term risk is the November COVID-19 outbreak that has triggered renewed restrictions in northern Europe, particularly Austria, Germany, and the Netherlands. Vaccination rates are high and containment measures should be targeted and regional. There is a risk, however, that growth slows over the winter months.
          The MSCI EMU Index, which reflects the European Economic and Monetary Union, has potential to outperform in coming quarters. Europe’s exposure to financials and cyclically sensitive sectors such as industrials, materials and energy, and its relatively small exposure to technology, should benefit these markets as delta variant fears subside, economic activity picks up and yield curves steepen.
          United Kingdom
          The UK looks likely to achieve another year of above-trend GDP growth in 2022, although slower than 2021. The more rapid rollout of vaccine booster shots means the UK is better placed to cope with COVID-19 outbreaks than elsewhere in Europe. 
          Brexit, however, has placed constraints on labor supply and this is putting upward pressure on wages and inflation. It is also encouraging the Bank of England (BoE) to begin lifting interest rates. Markets are priced for rates to begin rising in February. Senior BoE officials have warned of inflation risks, making an early rate hike likely. Declining inflation during 2022 as supply constraints ease should, however, convince the BoE to act cautiously.
          UK equities have lagged the global rally in 2021. Sector composition continues to be a headwind, and the technology exposure of the FTSE 100 Index is amongst the lowest of developed markets. The index is the cheapest of the major developed equity markets and offers a dividend yield of close to 3.5% as of November 2021. It has the potential to outperform in a global cyclical rally as fears around inflation and COVID-19 ease.
          Japan
          The Japanese recovery remains lackluster, with consumption still below pre-COVID-19 levels. Looking to 2022, we should see some acceleration in economic activity. Consumers are sitting on excess savings, and the catch-up in vaccination rates will encourage more mobility and spending. The recently elected government of Prime Minister Fumio Kishida has announced a supplementary fiscal package of around 5.5% of GDP, which will flow through the economy in 2022. A pick-up in business confidence, and the structural challenges with an ageing demographic, should see businesses increase investment.
          Unlike other countries, inflation has remained very subdued in Japan, due to softer demand and fewer challenges with supply chains. We expect a very modest pick-up in inflation through 2022 given import prices have been rising. However, this should not pose a challenge to the Bank of Japan, which will likely lag other central banks in raising interest rates.
          China
          We are cautious on the outlook for China in 2022. The risks around the property market and the drag on the economy from construction has grown. The Chinese government has recently announced initiatives that have reduced the likelihood of the worst-case scenario by further ringfencing the risks around property and encouraging mortgage demand. This is a key watchpoint over coming months.
          COVID-19 outbreaks will continue to present a risk to the economy until at least the 2022 Winter Olympics in Beijing, given the maintenance of the ‘zero tolerance’ approach to infection outbreaks. Regulation on the large consumer technology companies remains an uncertainty. We expect further fiscal stimulus through 2022 focused on boosting household consumption, but it will unlikely be large enough to offset the drags from property market downturns.
          Canada
          Strong domestic demand, a positive global business cycle, and firm commodity prices create the conditions for abovetrend growth for the Canadian economy in 2022. We think GDP growth could be around 3.8%. We are less convinced that the Bank of Canada (BoC) will hike as much as the markets are pricing. The net effect should be modestly higher bond yields, a strengthening Canadian dollar, and positive returns for domestic equities.
          The BoC is focused on a tight labor market and uncomfortably high inflation. It has ended quantitative easing and is now preparing markets for a mid-2022 rate hike. We are not convinced the BoC will hike as much as markets are pricing: roughly five hikes, lifting the target rate to 1.5% by the end of 2022. Two hikes seem more likely, keeping the BoC more in line with the Fed.
          Australia and New Zealand
          The Australian economy should pick up through 2022 as the country reopens after the sustained lockdowns through Q3 and early Q4 of 2021. Consumers still have excess savings, and there remains a large amount of pent-up demand for domestic travel. Australia has not seen the same levels of wage pressure as other regions, with many employers waiting for the re-opening of the borders and the return of the migrant flow of workers. This should give the Reserve Bank of Australia (RBA) breathing room from having to raise rates, and we think a rate rise is unlikely through 2022. The Australian dollar (AUD) is close to fair value on purchasing power parity, and we expect the AUD has some upside given traders are very negative on the currency.
          The New Zealand economy should see robust growth through 2022 with the eventual re-opening of international borders boosting export demand. The political will to undertake sharp lockdowns remains higher in New Zealand than many other countries, which will remain a risk – but the seasonality of the next couple of months plus the pick-up in vaccination rates are encouraging. The Reserve Bank of New Zealand continues to run ahead of other developed central banks in raising interest rates on inflation concerns amid a labor market that has more than fully recovered. We expect further rate hikes from the RBNZ through 2022, which will prove a headwind to the housing market.

          Asset-class preferences: Outlook on stocks, bonds and currencies

          Our cycle, value and sentiment investment decision-making process in late September 2021 has a moderately positive medium-term view on global equities. Value is expensive across most markets except for UK equities, which are near fair value. The cycle is risk-asset supportive for the mediumterm. The major economies still have spare capacity and inflation pressures appear transitory, caused by COVID-19-related supply shortages. Rate hikes by the U.S. Fed seem unlikely before the second half of 2023. Sentiment, after reaching overbought levels earlier in the year, has returned to more neutral levels.
          We prefer non-U.S. equities to U.S. equities. Above-trend global growth and steeper yield curves should favor undervalued cyclical value stocks over expensive technology and growth stocks. Relative to the U.S., the rest of the world is overweight cyclical value stocks.
          Emerging markets equities will remain under pressure from the China slowdown and central bank tightening across other EM economies to contain inflation pressures. EM equities could do well if there is significant China stimulus early in the year, the Fed stays on hold and the U.S. dollar weakens, but otherwise face headwinds heading into 2022.
          High yield and investment grade credit are expensive on a spread basis but have support from a positive cycle view that supports corporate profit growth and keeps default rates low.
          Government bonds are expensive, and yields will face upward pressure as above-trend growth closes output gaps. We expect the U.S. 10-year Treasury yield to rise toward 2% over 2022.
          Real assets: Real Estate Investment Trusts (REITS) have significantly outperformed Global Listed Infrastructure (GLI) so far this year, to the extent that REITS are now expensive relative to GLI. Both should benefit from the pandemic recovery, but GLI has some catch-up potential. GLI should benefit from the global recovery boosting transport and energy infrastructure demand. Commodities have been the best-performing asset class this year amid strong demand and supply bottlenecks. The gains have been led by industrial metals and energy. Commodities should retain support from above-trend global demand, but the slowdown in China limits upside potential.
          The U.S. dollar has been supported by expectations for early Fed tightening and U.S. economic growth leadership. It should weaken as global growth leadership rotates away from the U.S. and as expectations for early Fed tightening are unwound. The main beneficiary is likely to be the euro, which is still undervalued. We also believe British sterling and the economically sensitive commodity currencies—the Australian dollar, New Zealand dollar and Canadian dollar—can make further gains. We think the Japanese yen has upside potential given its undervaluation and supportive real yields. Sentiment is also a positive with investors crowded into short yen positions.

          Source:Russell Investments,Author:Andrew Pease

          Risk Warnings and Disclaimers
          You understand and acknowledge that there is a high degree of risk involved in trading. Following any strategies or investment methods may lead to potential losses. The content on the site is provided by our contributors and analysts for information purposes only. You are solely responsible for determining whether any trading assets, securities, strategy, or any other product is suitable for investing based on your own investment objectives and financial situation.
          Comments
          Add to Favorites
          Share

          Geopolitical Situation Affects Oil Prices, A Seven-week High Was Hit

          At the beginning of Asian trading on Friday (Jan. 7), U.S. oil is currently trading near $79.50/barrel; oil prices rose over 3% on Thursday, with U.S. oil once breaking above the $80 'barrier' during the session, peaking at $80.24/barrel, the highest since Nov. 18, 2021. Influenced by the escalating tense situation in Kazakhstan, as well as the extreme cold weather disturbing oil transportation and OPEC's insufficient production, oil prices are surging.

          Positive Factors Affecting Oil Prices

          Social unrest in Kazakhstan leads to production adjustments at the country's largest oil field
          Rising fuel prices have caused protests to erupt in Kazakhstan, where authorities face the greatest threat since the country's independence in 1991, and Russia and its allies have sent troops to help quell the turbulence there.
          Kazakhstan's largest oil producer has adjusted production at its Tengiz field due to unrest and protests. "production was temporarily adjusted due to logistical problems," Tengizchevroil (TCO), the field's operator, said in a statement, "some contractor employees rallied at the field in support of protests across Kazakhstan."
          TCO, a Chevron-led joint venture, produces about one-third of Kazakhstan's total national output. The company declined to give more details on the size of the production adjustment, but said production continues.
          TCO needs a key oil pipeline through Russia to remain operational so it can guarantee the export of oil from the Tajiz field. The pipeline's operator, Caspian Pipeline Consortium, said in a statement earlier Thursday that the pipeline was "operating normally" after Kazakhstan's president declared a state of emergency the night before. Kazakhstan is a member of the OPEC+ alliance. According to government data, the country will produce about 1.88 million barrels per day of crude oil and condensate in December 2021. Kazakhstan's government press service said it has imposed temporary state price controls on gasoline and diesel sales for 180 days.
          Libya's oil production fell to 729,000 barrels per day, the National Oil Company (NOC) said, after hitting a high of more than 1.3 million barrels per day last year due to maintenance and oil field closures.

          OPEC's Limited Production Capacity Constraints Supplying

          The oil prices have been hiking since the very beginning of the new year despite the OPEC+ coalition of OPEC and its allies sticking to previously agreed targets for production increases and a surge in U.S. inventories of refined oil products.
          According to a survey, the Organization of the Petroleum Exporting Countries' December 2021 oil production increase was again lower than the planned increase agreed with allies, highlighting that capacity constraints are curbing supply as global demand recovers from the epidemic.
          Even though it is a fact that the production from OPEC increased, the market remains recessed as insufficient production is unable to meet the requirements.

          The Fed Is Likely to Raise Interest Rate In March And Then Taper

          St. Louis Fed President Bullard said the Fed could start raising interest rates as early as March and then reduce its balance sheet as the next step to curb inflation.
          Bullard took an optimistic view of the U.S. economic outlook, saying the economy will grow "above trend" thanks to fiscal and monetary policy support. Omicron, he said, wouldn’t bring much risk to the country because the U.S. may share the same pattern with South Africa whose confirmed cases have already peaked and are declining.

          Snowstorm Continues To Affect Northeastern U.S.

          Severe cold weather disrupted oil deliveries in Canada and the northern U.S., boosting oil prices as U.S. crude inventories fell. The Washington Post reported on Jan. 6 local time that extreme weather warnings have been issued across the northeastern U.S. as a result of the ongoing snowstorm. Boston issued a winter storm warning on the 6th, and Washington, D.C., also issued a warning that snow will begin falling on the evening of the 6th and will cool sharply on the 7th. According to the warning issued by the National Weather Service, New York State may also experience major traffic disruptions on the morning of the 7th.
          According to U.S. statistics recording power outages across the country, more than 100,000 customers remain without power in Virginia as a result of the snowstorm.
          According to the weather service, snow began falling in parts of Missouri and Tennessee on the 6th, and parts of West Virginia, Massachusetts, Rhode Island, and Maine will also see up to 30 cm of snow.

          Negative Factors Affecting Oil Prices

          S&P 500 Continues To Fall As The Fed’s Showed Latest Hawkish Stance

          U.S. stocks closed lower, with mixed gains and losses during the session, as the market assessed the impact of the latest hawkish stance from the Fed on stock valuations. The S&P 500 index ended slightly lower, following Wednesday's heavy drop of 1.9%, and then rebounded 0.5% during Thursday's session; the Fed released the minutes of its December meeting on Thursday to release signals for an early rate hike, and the hawkish stance put risk assets under pressure, with St. Louis Fed President Bullard saying the Fed could start raising rates as early as March and then reduce its balance sheet as the next step to curb inflation.
          Fed president in San Francisco said they would likely reduce the size of the balance sheet after the first rate hike. 
          As it stands, the Fed has never been seen to both raise interest rates from zero levels and reduce the size of its balance sheet at the same time. In the last cycle, there was a two-year time lag between the two, so this move by the Fed may worry the market.

          Iran Heard the Good News About the U.S. During Nuclear Talk

          “We heard good news from the U.S. delegation in Vienna and the key is to see serious action,” Iran's foreign minister told Al Jazeera, adding that Iran hopes to get assurances that sanctions will not be imposed again. Iranian diplomats will return to the Organization of Islamic Cooperation in Saudi Arabia "within a few days" after what he said was an "informal" exchange of information with the United States in Vienna.

          A Difficult Winter Awaits In the U.S.

          Although symptoms of infection with the mutant strain of Omicron tend to be more mild, many hospitals are expecting to meet or exceed previous record highs in COVID patient admissions as it explodes in the United States.
          Hospitals are bracing for continued growth in bed demand for COVID patients in the coming month, according to data models from several healthcare facilities across the United States.
          The growing demand for beds has prompted health officials to step up some preventive measures, including urging people to get vaccination boosters and to wear high-quality masks, even though symptoms in people infected with Omicron appear to be milder than those of the previous strain.
          In some other countries, the peak of omicron infection tends to decline rapidly, but how steep its up-and-down trajectory will be in the United States remains a question. A forecast from the University of Washington's Institute for Health Metrics and Evaluation suggests that demand for hospital resources across the United States will peak in mid-February.

          U.S. Initial Jobless Claims Rise to 207,000 Last Week

          U.S. jobless claims rose last week, but remained near record lows as the labor market weathered the latest wave of the epidemic. First-time jobless claims totaled 207,000 in the week ended Jan. 1, up 7,000 from the previous week, Labor Department data released Thursday showed. The median economist estimate from a Bloomberg survey was 195,000. Continuing jobless claims rose to 1.75 million in the week ended Dec. 25.
          Even though first-time jobless claims saw rising, they have remained near fifty-year lows in recent weeks as companies struggle to maintain existing staff amid a widespread labor supply shortage and employee resignations. However, the widespread of the Omicron mutant strain has renewed economic concerns.

          U.S. Services Index Drops the Most In More Than A Year And A Half In December

          An indicator measuring the state of U.S. service providers abruptly retreated from a record high in December, reflecting a slowdown in business activity and order growth. Data released Thursday showed the Institute for Supply Management's (ISM) services activity gauge fell to 62 from 69.1 a month earlier, below expectations of all economists surveyed by Bloomberg, which had a median estimate of 67. An index above 50 indicates expansion in manufacturing activity. The 7.1 percentage point drop was the largest since April 2020 and may indicate the spread of the Omicron variant is beginning to take a toll on travel, dining out, leisure and other offline activities. However, even so, the services indicator remains well above pre-outbreak levels.
          While most indices saw a pullback in December, the service sector continued to grow at a strong pace, and surveyed companies said they continue to face inflation, supply chain disruptions, capacity constraints, logistics challenges, and labor and material shortages.
          In all, extreme cold weather in the U.S. disturbs oil transportation, turbulence in Kazakhstan escalates, partial production in Libya disrupts, and OPEC faces an insufficient production, oil prices seen rising; intraday oil prices are affected by the evening non-farm data, if the data is positive, oil prices will exist further upside. In addition, near the end of the week, the tense situation in Kazakhstan might be at risk of escalating again.

          Source: fx678.com

          Risk Warnings and Disclaimers
          You understand and acknowledge that there is a high degree of risk involved in trading. Following any strategies or investment methods may lead to potential losses. The content on the site is provided by our contributors and analysts for information purposes only. You are solely responsible for determining whether any trading assets, securities, strategy, or any other product is suitable for investing based on your own investment objectives and financial situation.
          Comments
          Add to Favorites
          Share

          What is the Collective Security Treaty Organisation?

          PROTESTS in Kazakhstan, an oil-rich country of 19m people, erupted in mass unrest in the opening days of the new year. Kassym-Zhomart Tokayev, the country’s president, knew who to call.
           Early on January 6th he picked up the phone to the Collective Security Treaty Organisation (CSTO). Within hours, Russian paratroopers and Belarusian special forces were boarding planes for Almaty, ready to help Mr Tokayev control the uprising.

          What is the CSTO?

          As the cold war drew to a close in July 1991, the Warsaw Pact, an alliance of eight socialist states, and the Soviet Union’s answer to NATO, dissolved. Less than a year later Russia and five of its allies in the Commonwealth of Independent States, a loose club of post-Soviet countries, signed a new Collective Security Treaty, which came into force in 1994.
          It was smaller, weaker and less ambitious than the Warsaw Pact. And with Russian power at a low ebb, the group did very little for many years. But in 2002, as Central Asia loomed larger in geopolitics—America had invaded Afghanistan the previous year—it declared itself the Collective Security Treaty Organisation, a full-blown military alliance. Today it has six members : Armenia, Belarus, Kazakhstan, Kyrgyzstan, Russia and Tajikistan (Uzbekistan quit the club in 2012).

          Russia's role in the CSTO

          For Russia, the CSTO is a useful tool to tighten its grip on Central Asia, against both Western and Chinese encroachment. It justifies Russian military facilities in member countries, while also giving Russia a veto over any other foreign bases in the region. In turn the CSTO’s members benefit from co-operation with Russia’s advanced armed forces, including training and discounted arms sales.
          Over the past decade, the CSTO’s ambitions have grown. In 2007 it agreed to create a 3,600-strong peacekeeping force and two years later established a rapid-reaction force of what it claims are 20,000 elite personnel kept on high alert. The alliance has also held joint exercises with increasing frequency, including a series of high-profile “anti-terrorism” drills last summer and autumn in response to the growing chaos in nearby Afghanistan.
          Until this week, though, no CSTO member had ever invoked Article 4 of its treaty, a mutual-defence clause akin to NATO’s better-known Article 5. The growing chaos in Kazakhstan, which Mr Tokayev blamed on foreign-trained “terrorist gangs”—the scapegoats of choice for most Central Asian dictators confronted by anti-regime movements—changed that. Nikol Pashinyan, the prime minister of Armenia, which holds the rotating chair of the CSTO, said that the group had agreed to send in peacekeepers. In addition to Russia and Belarus, Tajikistan and Armenia also agreed to send modest contingents.
          The alliance’s quick response may be a reassuring sign to the club’s other strongmen, including Alexander Lukashenko of Belarus, who received Russian—but not CSTO—assistance last year against his own protesters, and Tajikistan’s Emomali Rahmon, who has been in power for 28 years. In 2010, when Kyrgyzstan sought the group’s help in quelling an outbreak of violence, Russia declined to step in. A decade on, and with wars in Ukraine and Syria under its belt, Russian confidence has grown.
          Russia’s allies may also have some jitters, though. The CSTO did not support Russia’s wars against Georgia in 2008 and Ukraine in 2014, understandably wary of the precedent of having Russian troops carve out chunks of territory from ex-Soviet states. Vladimir Putin, Russia’s president, has long claimed that Kazakhstan, like Ukraine, is not a real country, and instead simply part of the “greater Russian world”. Mr Tokayev’s survival in office may come at the price of his country’s sovereignty. “CSTO has now proven that it is a defensive alliance,” quips Sergey Radchenko, a historian, echoing old Soviet jokes about the Warsaw Pact. “It only invades its own members.”

          Source:The Economist

          Risk Warnings and Disclaimers
          You understand and acknowledge that there is a high degree of risk involved in trading. Following any strategies or investment methods may lead to potential losses. The content on the site is provided by our contributors and analysts for information purposes only. You are solely responsible for determining whether any trading assets, securities, strategy, or any other product is suitable for investing based on your own investment objectives and financial situation.
          Comments
          Add to Favorites
          Share

          Plenty of Tech Stocks Down 50%, Bringing Back Painful Memories from the Internet Bubble?

          As a near-record number of technology stocks have been down 50% from their highs, many on Wall Street are being reminded of the painful memories of the Internet bubble at the turn of the century.
          About four in ten companies that make up the Nasdaq Composite Index have now seen their market capitalizations shrink by half from their 52-week highs, and most constituent stocks are in a bear market, Jason Goepfert, chief research officer at Sundial Capital research, said in a new report released Thursday.
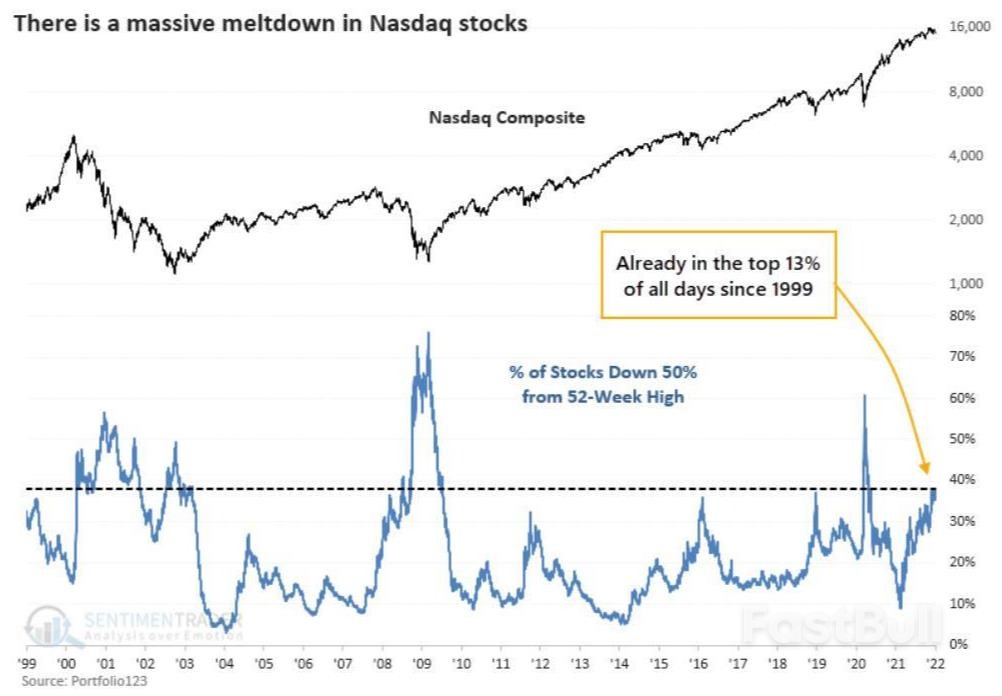
          Not since the dot-com bubble burst has so many stocks fallen by 50% like this when the index is so close to its peak.
          "Regardless of fundamentals and macro factors, there is no doubt that investors have been selling before trying to figure out other issues," Goepfert noted in the report. 
          "With valuations at all-time highs, companies have been raising billions of dollars, and the Fed hinted at a tightening cycle. All of this worried investors that we are on the verge of a repeat of the 1999-2000 crisis," Goepfert said.
          Since the start of the new year, technology stocks have been under pressure as the U.S. bond market has suffered a major sell-off - the 10-year U.S. Treasury yield has risen to 1.72%. The minutes of the Federal Reserve's December monetary policy meeting released on Wednesday showed that officials have discussed a possible early reduction of the Fed's balance sheet and an earlier-than-expected interest rate hike to fight inflation. This led market participants to generally believe that the Fed’s shift towards hawkishness is faster than expected.
          Traders then quickly sold off technology stocks as their high valuations are becoming increasingly unreasonable in an environment of rising interest rates. The Nasdaq Composite Index has fallen a cumulative 3.61% so far this week and may be on track for its biggest one-week decline since last November.
          All of this has brought trouble to active fund managers who have broad market exposure. Cathie Wood, the Wall Street's Queen of the Bull Market, who underperformed last year, suffered another setback at the start of the new year. Her flagship fund ARKK suffered its biggest decline since launching.

          Is there a connection between the Fed's tapering and the dot-com bubble?

          It is worth mentioning that the Fed's upcoming tapering is related to the Internet bubble 20 years ago.
          Many people believe that the final stage of the 1999 to 2000 stock market bubble and the subsequent collapse was because the Fed was scared by the unknown factors of the Y2K bug, Deutsche Bank strategist Jim Reid pointed out in the latest report released this week. The Fed had issued hundreds of millions of dollars of reserve funds to many U.S. banks in late 1999 to reduce the level of panic about the Y2K bug in the banking sector, and the money supply and the Fed's balance sheet spiked during that time.
          We all know that the Y2K scare did not come true. However, it was too late for the Fed to withdraw all liquidity which became a trigger for the bursting of the bull market bubble. Although there were many other potential causes of the bubble burst, the Fed's massive liquidity injection and withdrawal undoubtedly played a key role.
          Compared to the tapering during the dot-com bubble, the Fed's most recent tapering in 2017-2019 was much less of a shock to the market. Since October 2017, the Fed has cut its balance sheet from about $4.47 trillion to about $3.76 trillion at the end of August 2019. This tapering did not change the uptrend in the stock market in the long run, but there was still a sharp sell-off in U.S. stocks in the fourth quarter of 2018 when Powell said the key interest rate was probably still a “long way” from a so-called neutral level. That sparked fears of more rate hikes until January 2019, when Powell made a dovish turn and dispelled market fear.
          Reid noted that the Fed's balance sheet has surged from about $4.15 trillion at the beginning of the pandemic outbreak to $8.75 trillion now, which is an incredible amount to 1999 (from about $570 billion to $670 billion).
          Will the stock market perform more like 1999 and 2000 or 2018 and 2019 with the Fed's upcoming quantitative tightening (QT)?
          Reid argued that "the stock market faced setbacks in both experiences, albeit on different scales. The U.S. equity valuations now are comparable only to the 1999-2000 level. However, the current market liquidity remains very high, as we saw in 2018 and 2019 when QT lasted a year - accompanied by a series of rate hikes during that time - before finally triggering a market sell-off. Of course, the era of extremely, super, ridiculously accommodative monetary policy seems to be coming to an end anyway. Markets will inevitably be affected, although the timing is still up for debate."

          Source: cls.cn

          Risk Warnings and Disclaimers
          You understand and acknowledge that there is a high degree of risk involved in trading. Following any strategies or investment methods may lead to potential losses. The content on the site is provided by our contributors and analysts for information purposes only. You are solely responsible for determining whether any trading assets, securities, strategy, or any other product is suitable for investing based on your own investment objectives and financial situation.
          Comments
          Add to Favorites
          Share

          UK economic recovery will face multiple challenges in 2022

          High inflation hinders economic recovery

          The UK's CPI rose 5.1% year on year in November 2021, the highest level in a decade and well above the BOE's 2% inflation target, according to data released by the Office for National Statistics.
          In response to the continuing rising inflationary pressures, the BOE announced in December 2021 that it would raise the benchmark interest rate from a historic low of 0.1% to 0.25%. The BOE expects inflation to peak at around 6% in April 2022.
          High inflation has had a huge impact on people, especially low-income families. According to FINANCIAL TIMES’ survey, of almost 100economists, a majority said that UK living standards would worsen in the year ahead, with poorer households hit hardest by soaring inflation and higher taxes.
          Standard Life Aberdeen plc, a British investment company, said in a report that the worsening inflationary environment will weigh on economic growth and take a big hit to consumers' purchasing power.

          The aftermath of Brexit may aggravate trade friction

          In 2022, the UK's new import formalities on EU goods officially took effect. Industry insiders are concerned that the new formalities could exacerbate trade frictions between the UK and the EU.
          According to the regulations, from January 1, 2022, non-controlled goods entering the UK from the EU will no longer be subject to the original 175-day delay in customs clearance. A large number of companies or freight forwarders will have to complete a full customs declaration at the time of clearance in the UK, and the customs department will decide whether to carry out further checks on goods according to the circumstances.
          Kitty Ussher, the chief economist at the Institute of Directors, said this will exacerbate existing supply chain problems, lead to further congestion at ports, and many businesses will incur additional costs as a result of unexpected breaches.
          Shane Brennan, chief executive of the Cold Chain Federation, said the new formalities could lead to logistical delays and additional costs. "It's a less flexible and more expensive process".
          The Telegraph said in an article that the new formalities would disrupt the existing process of importing goods from the EU, making imports "more expensive, less flexible and slower".

          Political uncertainty affects confidence in the recovery

          While the UK has completed its exit from the EU, it is still unclear whether Scotland will "exit" the UK. The pandemic has given the British government some breathing space to deal with the issue of Scottish independence. However, once the pandemic shows a significant improvement in 2022, whether the issue will return to the forefront has aroused attention and speculation.
          The Scottish National Party, which advocates Scotland to be separated from the UK, won the majority of seats in the Scottish Parliament in May 2021. The party leader Nicola Ferguson Sturgeon said she would seek a second independence referendum after Scotland through the pandemic.
          In addition, the current Johnson administration has been questioned over its handling of COVID-19, inflation, Brexit, and the withdrawal of troops from Afghanistan, and has seen its approval ratings slide. There is also uncertainty as to whether the Johnson administration will "survive" 2022, according to some media.
          However, some economists said the state of the UK economy may depend more on the development of COVID-19. Andrew Hilton, director of the Centre for the Study of Financial Innovation, was quoted by the FINANCIAL TIMES as saying that the falling real wages had less impact on consumers than "pessimism caused by fears of a continued blockade". Kitty Ussher said as long as there is the confidence that the worst of the pandemic is over, strong demand will keep the economic fundamentals moving in the right direction.

          Source: xinhuanet.com

          Risk Warnings and Disclaimers
          You understand and acknowledge that there is a high degree of risk involved in trading. Following any strategies or investment methods may lead to potential losses. The content on the site is provided by our contributors and analysts for information purposes only. You are solely responsible for determining whether any trading assets, securities, strategy, or any other product is suitable for investing based on your own investment objectives and financial situation.
          Comments
          Add to Favorites
          Share

          U.S. Equity Market 'Quaked', Is the Fed Really About to 'Take Action'?

          Most recently, the Fed’s series of Hawkish actions include but are not limited to the minutes of the December meeting that considered rapid tapering, as well as showing its eagerness to raise interest without waiting for QE to drop to 0. Such actions incurred a quake among the U.S. equity markets.
          In order to suppress inflation expectations, the "forward guidance" has been used in advance of the tapering step of the Fed, is it really to the extent that it has to make a “massacre”?
          Behind the back of the U.S. blooming economy, what kind of “Trade-with-devil” expense has it taken?

          Is the Fed Really About to Take Action?

          The U.S. equity market saw a decline most recently, its main cause was the beginning of a significant rise in the long end of U.S. bond yields. 10-year U.S. bond yield continues to rise and almost approaches its 52-week high. This is an unsettling sign for the equity market.
          Its root cause is quite understandable: Valuation multiples in the equity market are based on the long-term risk-free rate of return, i.e., the long-end yield on U.S. bonds as the discount rate; an increase in the discount rate will naturally lead to a decrease in the valuation multiple.
          Meantime, the other layer of the root cause is that: In the past, the direction of volatility in the U.S. equity market has had a significant positive correlation with the direction of volatility in the long end of U.S. bond yields, i.e., when the equity market falls, U.S. bond yields fall; and when the equity market rises, U.S. bond yields rise. This relationship can serve as a cushion for the equity market to a certain extent - as falling U.S. bond yields can boost valuations and subsequently slow down the downward momentum of the equity market.
          However, prolonged QE operations the Fed made have distorted this long-standing cushion: The current situation is that the equity market sees rising while the U.S. bond yield continues to decline and thus further stimulate the equity market to rise, causing the original cushion to disappear - i.e., if equity market falls but the U.S. bond yield is still rising on their own just like at this current phase, it will, on the contrary, exacerbate the falling trend of the equity market instead of 'slowing it down'.
          In the event that the Fed eventually has to withdraw QE, or even taper, U.S. bond yields will have to face ever-accumulating upward pressure - because U.S. bonds are now clearly negative real yields, and no rational investor or institution or country will be willing to increase their holdings (unless there is a request to the U.S., in exchange for disguised benefits). So at the end there will be ultimately a large amount of U.S. debt and deficits out there while buyers end up with only the Fed.
          But now it seems that the Fed tends to terminate.

          Picture1: The Fed’s QE Operation in the last week of Dec in 2021

          From the listed chart above, we can see that the Fed QE had increased its holdings of 2.4 billion U.S. bonds, while reducing its holdings of 34.2 billion MBS, a net reduction of more than 30 billion; of course, this is related to the net increase of more than 130 billion U.S. dollars in the first three weeks of December - in this way, basically fulfilling the Fed's previous commitment made in December The "promise" of "at least" $90 billion in QE did fall by $30 billion/month compared to the previous pace of QE.
          Since the Fed was actually tapering operations in the last week of December, it was actually a net withdrawal of liquidity from the market, so it led to a rapid decline in overall market liquidity after surging higher at the end of last year.
          In the new year 2022, the Fed's QE is not as aggressive as it was at the beginning of December last year, but of course, there is also a relationship with the intervening New Year holidays, but the overall QE pace is relatively much slower.

          Picture2: The Fed’s first QE Operation in the first week in Jan 2022

          From the chart above, we can see that in the first week in January 2022, the Fed had only QE an amount of over $9 billion.

          The “Expense” It Costs Behind the Scene of Booming Economy

          In fact, from the data point of view, though the epidemic in the U.S. is kind of severe and some economic data dropped from their highs or had already reached their peaks (e.g. PMI,CPI, etc.), everything we can see in the chart shows that the U.S. economy has basically completed the recovery no matter in the data of PMI, employment, job openings or consumption, inflation or other core data - as long as the economy is not blocked again, the current state is perfectly acceptable for the Fed to "pull out".

          Picture3: U.S. epidemic is showing its fierce side, but no one ever mentions the lockdown again. It is obvious that economic lockdown is no more an 'option'

          Behind this reality, a chilling fact is hovering: the U.S. is now adopting policies that, in a cold-blooded way, are good for its long-term economic development, but at a cost that is "devilish".

          Picture4: Age distribution of COVID-related deaths published by the U.S. CDC

          It is clear from the above US own statistics that the deaths caused by the epidemic show an extremely high positive correlation with age, and also more importantly: among the main workforce under 50 years old, the number of deaths in the last two years of the virus and its cousin variant ravage was just a little over 50,000 - less than the number of deaths from car accidents in the US in those two years; in addition, there were only 694 deaths of underage children: the children who were infected because of the large base, and it is statistically possible to assume that most of these unfortunate deaths would have had some immune deficiency of their own. The result is that of the 825,000 deaths, more than 770,000 were over the age of 50, including those over 65, more than 620,000.
          Besides, there were 300,000 to 400,000 "excess" deaths in the United States during this period (i.e., more deaths than in "normal years" after removing the number of deaths caused by the COVID virus). The causes of these "excess" deaths were mainly cancer and cardiovascular disease, the "diseases of the elderly" - which may have been related to the fact that the U.S. health care system was overwhelmed during the epidemic's sweeping period.
          In all, the U.S. has already lost more than 1 million people at the age of over 65 so far due to the epidemic; but those who are aged over 65 are mostly retired; and from the perspective of pure economy, they have gone from being net contributors to net consumers.

          Source: wallstreet.com

          Risk Warnings and Disclaimers
          You understand and acknowledge that there is a high degree of risk involved in trading. Following any strategies or investment methods may lead to potential losses. The content on the site is provided by our contributors and analysts for information purposes only. You are solely responsible for determining whether any trading assets, securities, strategy, or any other product is suitable for investing based on your own investment objectives and financial situation.
          Comments
          Add to Favorites
          Share
          FastBull
          Copyright © 2025 FastBull Ltd

          728 RM B 7/F GEE LOK IND BLDG NO 34 HUNG TO RD KWUN TONG KLN HONG KONG

          TelegramInstagramTwitterfacebooklinkedin
          App Store Google Play Google Play
          Products
          Charts

          Chats

          Q&A with Experts
          Screeners
          Economic Calendar
          Data
          Tools
          Membership
          Features
          Function
          Markets
          Copy Trading
          Latest Signals
          Contests
          News
          Analysis
          24/7
          Columns
          Education
          Company
          Careers
          About Us
          Contact Us
          Advertising
          Help Center
          Feedback
          User Agreement
          Privacy Policy
          Business

          White Label

          Data API

          Web Plug-ins

          Poster Maker

          Affiliate Program

          Risk Disclosure

          The risk of loss in trading financial instruments such as stocks, FX, commodities, futures, bonds, ETFs and crypto can be substantial. You may sustain a total loss of the funds that you deposit with your broker. Therefore, you should carefully consider whether such trading is suitable for you in light of your circumstances and financial resources.

          No decision to invest should be made without thoroughly conducting due diligence by yourself or consulting with your financial advisors. Our web content might not suit you since we don't know your financial conditions and investment needs. Our financial information might have latency or contain inaccuracy, so you should be fully responsible for any of your trading and investment decisions. The company will not be responsible for your capital loss.

          Without getting permission from the website, you are not allowed to copy the website's graphics, texts, or trademarks. Intellectual property rights in the content or data incorporated into this website belong to its providers and exchange merchants.

          Not Logged In

          Log in to access more features

          FastBull Membership

          Not yet

          Purchase

          Become a signal provider
          Help Center
          Customer Service
          Dark Mode
          Price Up/Down Colors

          Log In

          Sign Up

          Position
          Layout
          Fullscreen
          Default to Chart
          The chart page opens by default when you visit fastbull.com